


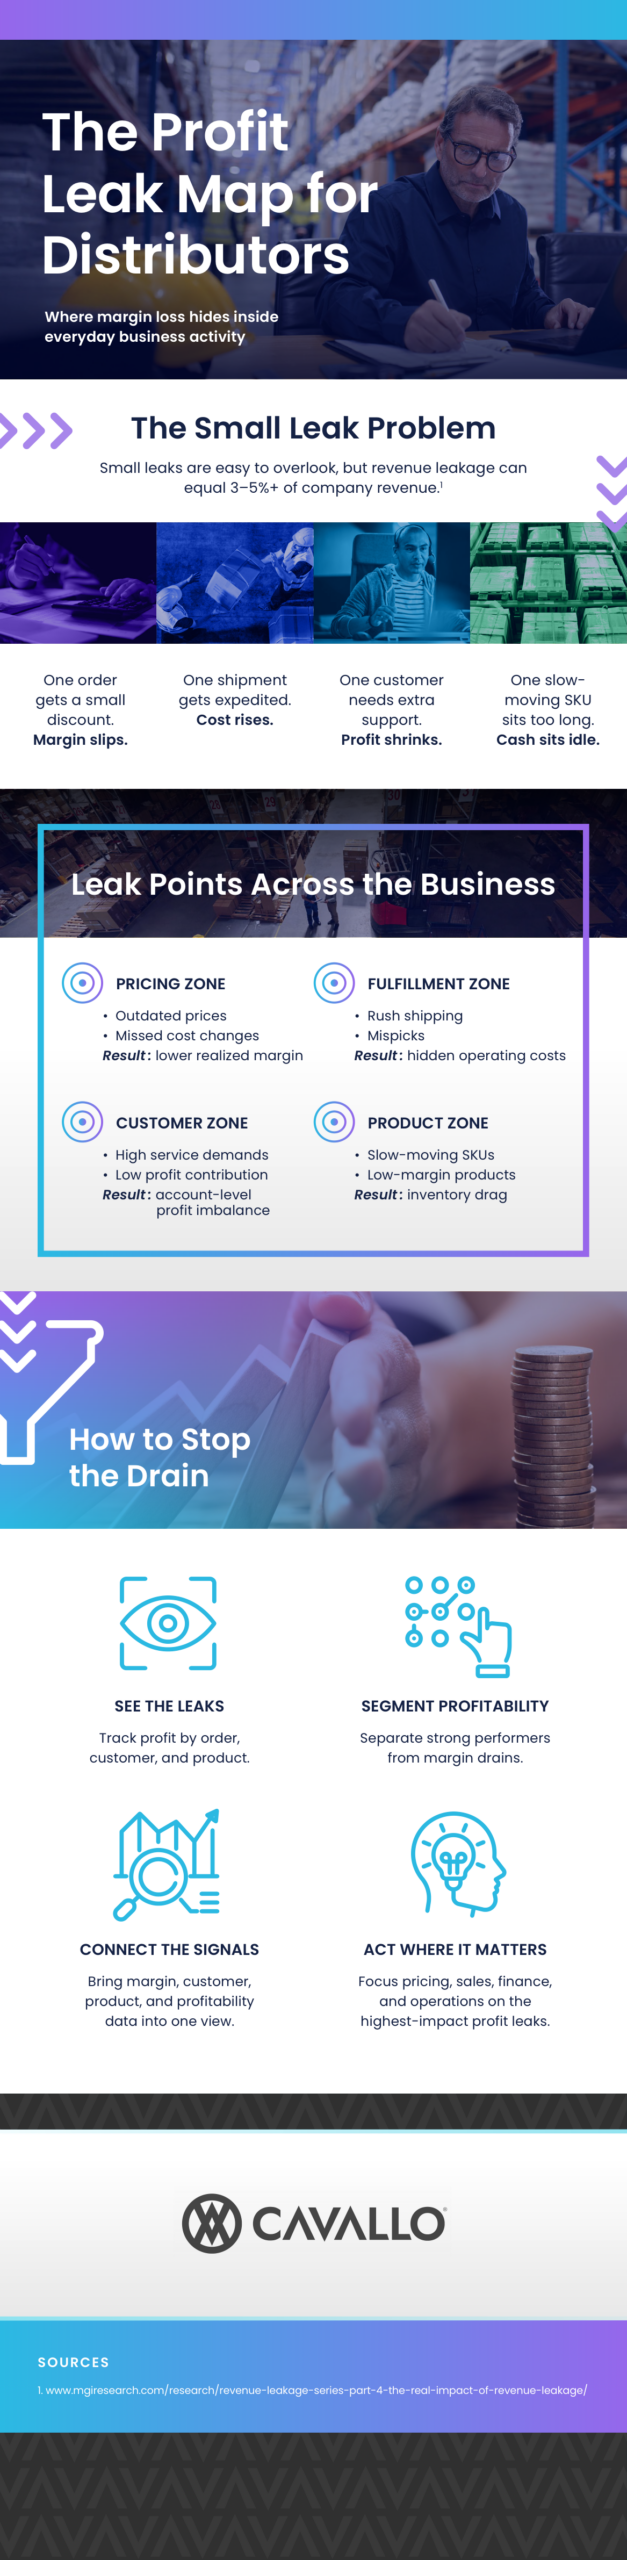
Strong sales do not always translate into strong profits. For distributors, small operational inefficiencies can quietly reduce margins over time without attracting immediate attention. Pricing inconsistencies, inventory challenges, fulfillment errors, and rising operating expenses often develop gradually, making them difficult to detect through financial statements alone. Creating a profit leak map helps businesses identify where revenue is being lost and prioritize improvements based on measurable data.
Identify Where Profit Begins to Slip
Profit leaks often start with routine business processes. Inventory that remains in storage too long increases carrying costs, while stock shortages can lead to expedited shipping fees and missed sales opportunities. Pricing errors, inaccurate purchasing costs, frequent product returns, and order fulfillment mistakes also reduce profitability, even when sales volume remains steady.
Reviewing performance metrics across these areas provides a clearer picture of where margins are shrinking. Monitoring inventory turnover, gross margin by product category, order accuracy, supplier performance, and customer profitability helps business leaders identify patterns that may otherwise go unnoticed.
Connect Operational and Financial Data
Many distributors collect large amounts of operational information, but valuable insights can remain hidden when departments work independently. Sales, purchasing, warehouse operations, finance, and customer service each generate data that contributes to overall profitability.
Bringing this information together through centralized reporting allows decision-makers to compare trends across the business. Organizations using Dynamics GP distribution software can strengthen visibility by combining financial records with inventory, purchasing, and fulfillment data to create dashboards that support faster and more informed decision-making. A connected view of operations makes it easier to identify exceptions before they become costly problems.
Turn Data Into Action
Finding profit leaks is only the first step. Businesses should establish performance benchmarks, assign ownership for improvement initiatives, and measure results over time. Reviewing key performance indicators on a regular basis helps leaders determine whether operational changes are producing measurable financial benefits.
Examples of meaningful metrics include inventory accuracy, warehouse productivity, order cycle times, return rates, and supplier delivery performance. Small improvements across several operational areas can produce meaningful gains in profitability without requiring significant increases in sales volume.
Employee involvement also contributes to long-term success. Teams that regularly review operational data are often better equipped to identify process improvements and recommend practical solutions based on firsthand experience.
Build a Culture of Continuous Improvement
Profit leak mapping should become an ongoing business practice rather than a one-time project. Markets, customer expectations, supplier relationships, and operating costs continue to change, making regular performance reviews an important part of maintaining healthy margins.
Organizations that consistently evaluate operational and financial data are better positioned to identify inefficiencies early, improve resource allocation, and strengthen long-term profitability. A structured approach to monitoring business performance helps distributors make informed decisions and create a more efficient, resilient operation. Look over the infographic below for more information.
Want AI doing the heavy lifting in your marketing?
I build the systems that handle the boring 80 percent, so you get your week back. Done properly, with the human kept in.
Related reading: Freelance Jobs: The Real Money, Real Clients, and Real Rejection Guide and Jobs That Work From Home: The Real Pay, the Real Roles, and What Exists in 2026.
Bottom line: Most distributors lose margin in small, hidden places rather than one big mistake, things like manual pricing errors, rebate mismanagement, and shipping cost creep. Mapping these leak points system by system is the fastest way to recover profit without cutting staff or raising prices. Fix the map once and the savings compound every quarter after.
Frequently asked questions
What is a profit leak map?
A profit leak map is a visual breakdown of every point in a distributor's operations where margin quietly disappears, such as pricing, freight, rebates, returns, and inventory handling. It helps teams see the full picture instead of chasing one issue at a time.
Where do distributors usually lose the most margin?
The biggest culprits are typically inconsistent pricing across customers, unclaimed vendor rebates, freight cost overruns, and manual order errors. These add up quietly and rarely show up as a single line item on a financial report.
How often should a distributor review for profit leaks?
A quarterly review works well for most distributors, though high volume businesses benefit from monthly checks on pricing and freight in particular. Regular reviews catch small leaks before they turn into bigger losses.
Can small distributors benefit from this approach too?
Yes, in fact smaller distributors often see a faster return since even minor margin leaks make up a larger share of overall profit. Building the habit early makes scaling much easier later on.

