Canva, Piktochart, Venngage, Adobe Express and Visme are the five tools worth using to design beautiful infographics. I've tested all five on client projects and each handles templates, icons and colour palettes without needing design training. Canva wins for speed and a huge free library, while Piktochart and Venngage suit data heavy charts better. Visme is strongest for animated or interactive versions, and Adobe Express fits neatly if you already use other Adobe apps.
Infographics remain one of the most-shared content formats in 2026 across LinkedIn, Pinterest, and X, with well-designed pieces routinely outperforming written content for engagement and link-building. The good news is you no longer need a designer to produce them. This guide covers the 5 best tools to design beautiful infographics in 2026: free options for getting started, mid-tier picks with templates and brand kits, and professional tools for design teams. Each includes realistic learning curves and pricing.
In recent years, visual content has been dominating readers’ preferences, whether it’s images, video or infographics. Their creation, unfortunately, is a bit more difficult and time-consuming than a regular blog post. So in this post, I’m going to cover everything you need to know about how to create an infographic and the tools that will do all the hard work for you.How to create beautiful infographics without a designer
To design a beautiful infographic without hiring a designer, start from a template in a tool like Canva, Piktochart, Venngage or Visme, then keep it simple: two or three colours, one clear font pairing, and one idea per section. Lead with the single number or takeaway you want people to remember, use icons instead of clip art, and leave plenty of white space so it stays readable when shared. The tools and step-by-step tips are below.
Why infographics?
As a content creator, it’s important to bring some diversity to the content you provide in order to attract a bigger audience and to make sure you keep your current audience interested. People love infographics – and with good reason, if I do say so myself. They’re much more fun than regular blog posts and they provide a lot of useful information that the reader can go through in just a few minutes, which are just some of the reasons why infographics have a much better chance at going viral in your niche’s audience. Infographics are colourful and eye-catching and so long as the title is also catchy, you massively increase your chances of driving traffic. Another great part about infographics is that if you create a good one, you can host it on other websites, and other bloggers might want it on their blogs as well, which means you’re going to get a lot of links back to your website. So when you’re planning and strategizing your content calendar, make sure to add a few ideas for infographics – and make sure you also have time to promote it so you can get the most out of it. [clickToTweet tweet="5 Tools to Design Beautiful Infographics via @lilachbullock" quote="5 Tools to Design Beautiful Infographics via @lilachbullock"]Types of infographics
So, you’ve decided to create your own infographic – now, the question is, what should it be about? Whatever niche you may be in, there is sure to be a type of infographic that will work for you. Here are some of the most common styles of infographics:- Data visualisation – turn your charts, data and numbers into beautiful visualisations that are easier to understand
- Comparisons – compare two or more things to highlight the differences between them
- How-to’s/lists – turn your how-to or list based blog posts into easier to read visual content
- Tell a story chronologically
Start creating your infographic
Many don’t even try to create an infographic as they believe you have to be a designer in order to do so – however, there are now plenty of really cool, free and cheap tools that basically do all the hard work for you. Or, if you want to create a more complex infographic strategy, there are numerous agencies that can help with that and create the infographics for you. This, though, can be a bit more costly than creating them by yourself. Here are some of the top tools on the market right now that can help you create an infographic in just minutes:1. Visme
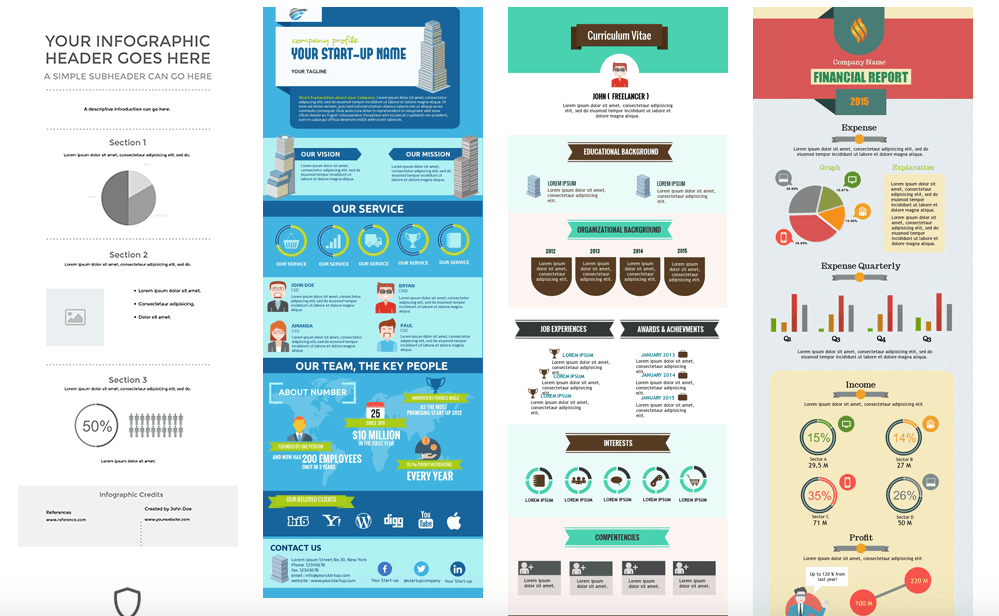
 Visme is a favourite of mine as I’ve recently worked with them on some infographics and absolutely loved the results. With Visme, you can turn any of your ideas into beautiful visual content, such as infographics, presentations and reports.
You can very easily create a new account by signing in with Facebook, and get started on your project right away with one of their templates. They have some beautiful templates to choose from, and if you want access to all of them, you have to upgrade your account to premium.
Visme is very easy to use and I really like their selection of animations, images and even audio and video – basically everything you need to create a stunning infographic.
Visme is a favourite of mine as I’ve recently worked with them on some infographics and absolutely loved the results. With Visme, you can turn any of your ideas into beautiful visual content, such as infographics, presentations and reports.
You can very easily create a new account by signing in with Facebook, and get started on your project right away with one of their templates. They have some beautiful templates to choose from, and if you want access to all of them, you have to upgrade your account to premium.
Visme is very easy to use and I really like their selection of animations, images and even audio and video – basically everything you need to create a stunning infographic.
2. Canva
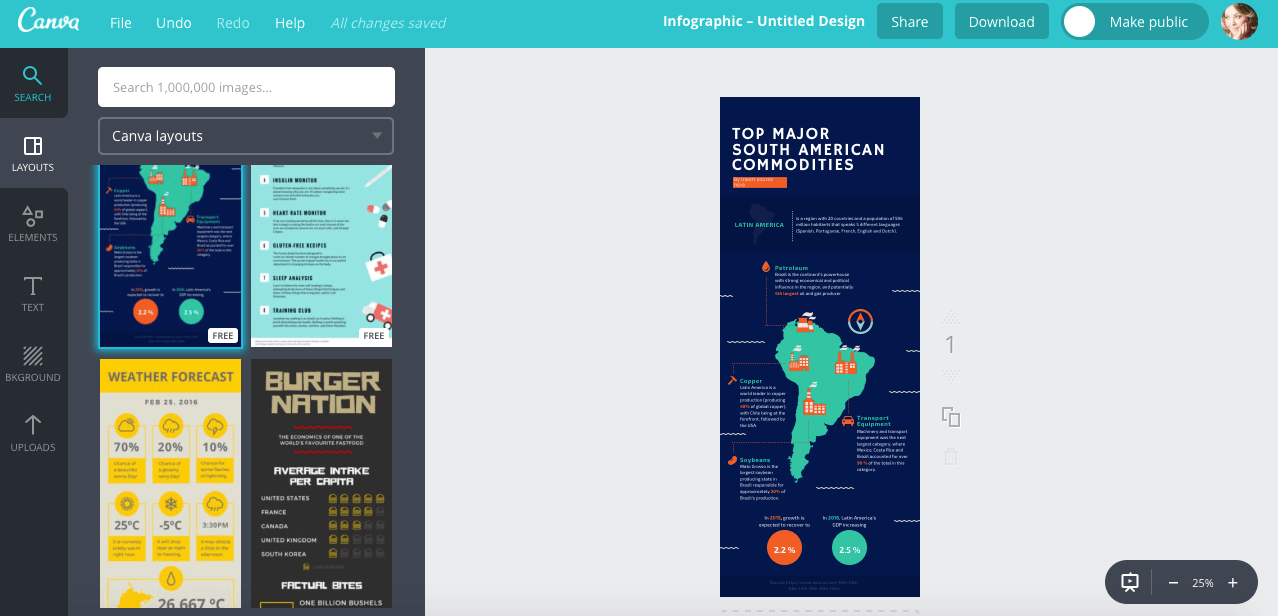
Canva is another one of my favourites of the list and I often use it for both infographics and creating images. It’s a free tool that is incredibly easy to use by anyone, even without any design or Photoshop knowledge. If you want, before you start designing, you can check out one of their really good tutorials that cover everything from choosing the perfect font to writing the perfect headline. They also have a tutorial for creating infographics that you can check out. To start creating your infographic, simply click on “More” under “Create a design” at the top of your Canva account, and then scroll down until you get to infographics.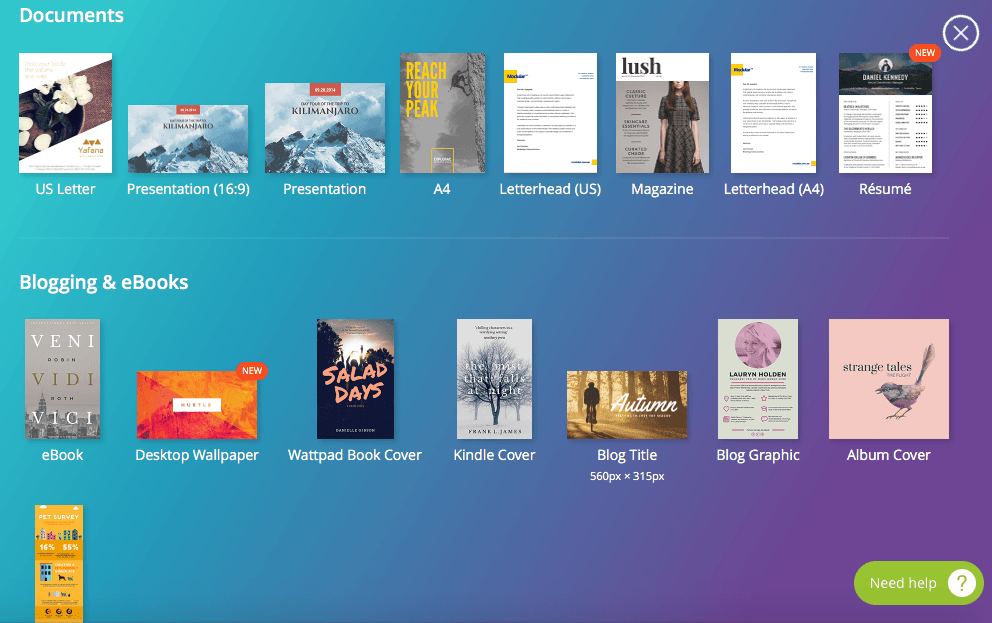 From there, it’s very easy to start creating your own. Simply choose a template for your infographic, and start adding your text and choose between the images and elements provided by Canva, or even upload your own. They have a lot of free images, but for some of them, you have to pay.
 [clickToTweet tweet="5 Tools to Design Beautiful Infographics via @lilachbullock" quote="5 Tools to Design Beautiful Infographics via @lilachbullock"]
3. Piktochart
Piktochart is a tool dedicated completely to creating infographics. You can create an account for free, but if you want access to all of the templates and get extra space for uploading your own images, you have to choose one of their monthly packages, which aren’t too costly.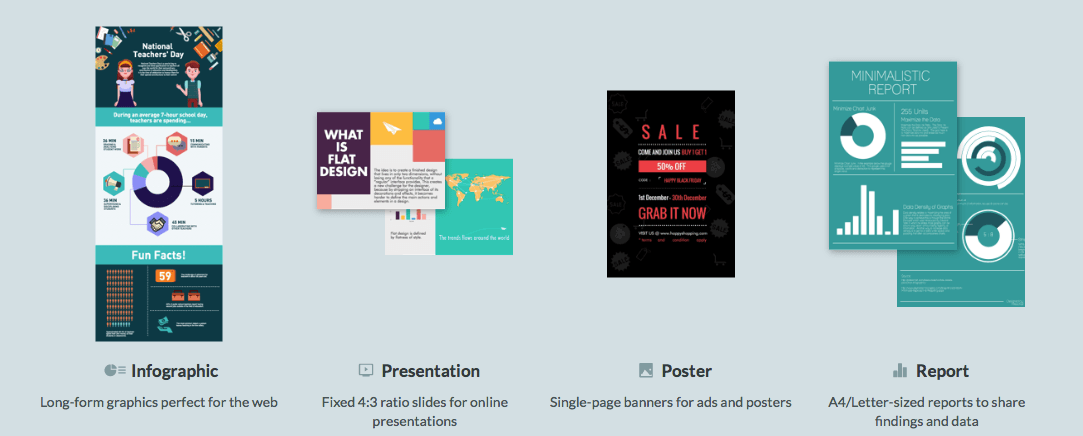 They have a library of over 500 different infographic templates that is updated weekly, and some of them are completely free to use. It’s also great for creating beautiful reports and presentations that will definitely impress your clients.
4. Venngage
Venngage is very similar to Piktochart, and just as easy to use. You can start creating infographics for free, but you’ll only have access to a limited number of templates, although enough to keep you going as a beginner.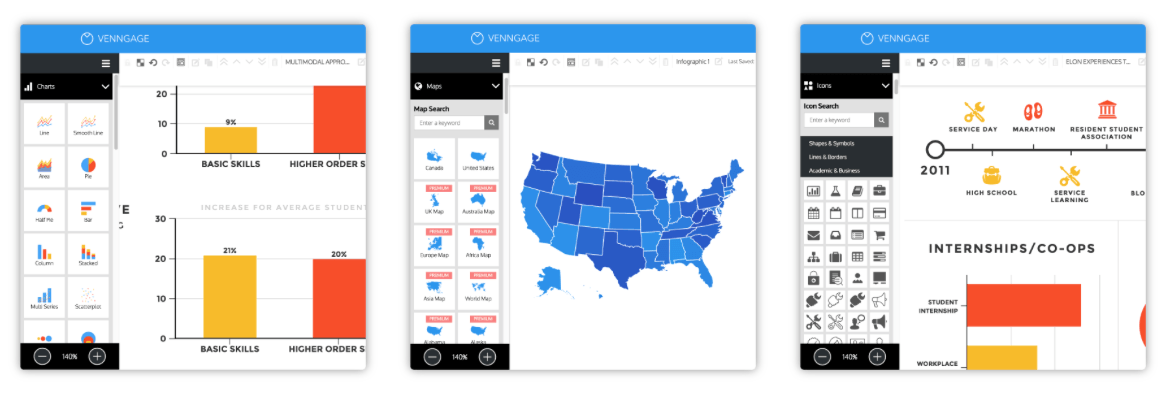 Just like with the previous tools mentioned, Venngage is very easy to use. All you have to do is choose a template, and start designing: add the text and charts you want and use images from the Venngage library to bring your infographic to life. You can also change the colours and fonts if you want to, and make it completely your own.
[clickToTweet tweet="5 Tools to Design Beautiful Infographics via @lilachbullock" quote="5 Tools to Design Beautiful Infographics via @lilachbullock"]
Just like with the previous tools mentioned, Venngage is very easy to use. All you have to do is choose a template, and start designing: add the text and charts you want and use images from the Venngage library to bring your infographic to life. You can also change the colours and fonts if you want to, and make it completely your own.
[clickToTweet tweet="5 Tools to Design Beautiful Infographics via @lilachbullock" quote="5 Tools to Design Beautiful Infographics via @lilachbullock"]
5. Easel.ly
With Easelly you can get started on your first infographic in seconds – you don’t even need to create an account. They have a lot of different templates to choose from, and once you get to the front page, all you have to do is click on the one you want to use.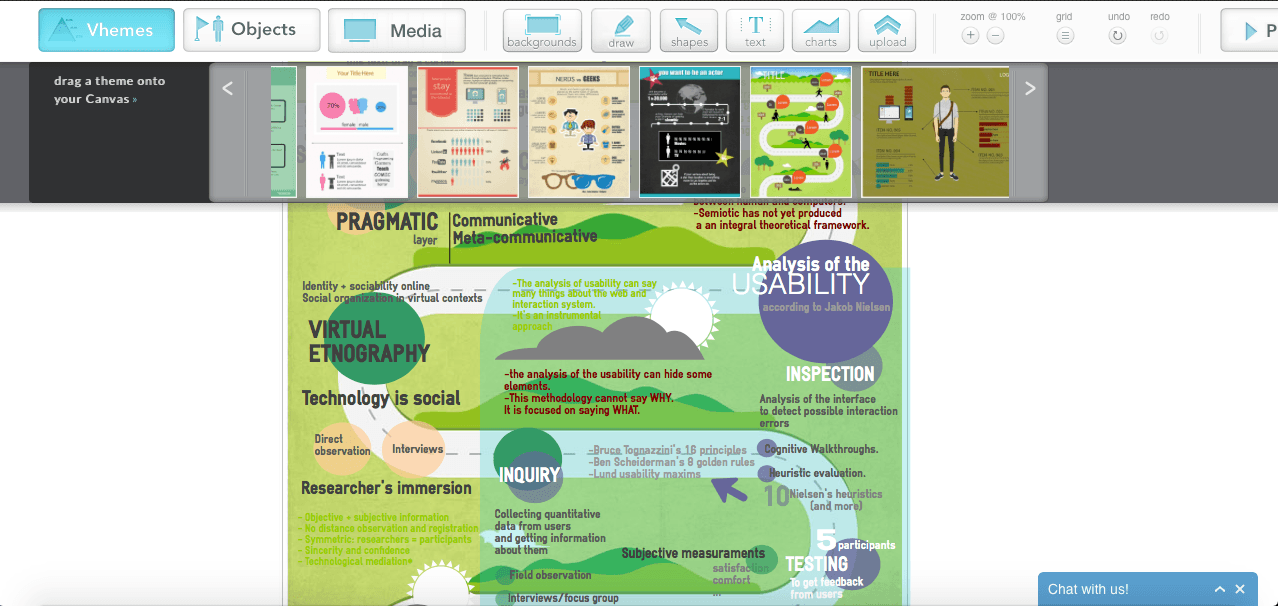 From there, the process is very intuitive. You can change the theme if you want, or start from scratch, add cute animations, charts, text and YouTube videos, and much, much more.
All of these tools are very easy to use – in fact, even as a beginner, you could probably create an infographic in about 30 minutes, so long as you don’t get lost in all of the images, animations and icons, like I sometimes do.
From there, the process is very intuitive. You can change the theme if you want, or start from scratch, add cute animations, charts, text and YouTube videos, and much, much more.
All of these tools are very easy to use – in fact, even as a beginner, you could probably create an infographic in about 30 minutes, so long as you don’t get lost in all of the images, animations and icons, like I sometimes do.
Conclusion
Infographics are a big part of content marketing in 2016, which is evidenced by the numerous tools that have popped up in recent years. There’s no excuse not to start creating your own infographics right now. There are so many great tools that you can use to design beautiful visualisations that will not only bring you in more traffic, more engagement and shares and more links, but that will also make your work day much more fun. Are you creating infographics for your website? Which tool do you use? Let me know in the comments section below and please share 🙂 [clickToTweet tweet="5 Tools to Design Beautiful Infographics via @lilachbullock" quote="5 Tools to Design Beautiful Infographics via @lilachbullock"]Infographic tools FAQ
What is the best infographic tool for beginners in 2026?
Canva remains the easiest entry point because of its template library and zero learning curve. For more polish without going full Adobe, Piktochart and Visme also work well for beginners.
Are AI infographic generators worth it in 2026?
AI generators are improving fast and useful for first drafts. They still tend to produce generic-looking output. Best workflow: AI for layout draft, human for final polish.
How much should you spend on infographic tools?
Most businesses get great results on free tiers or $12-30/month plans. Premium tools above $50/month are typically only worth it for design-heavy teams or agencies.
Want to go deeper? Read these next:
- The AI Tool Stack for Business Owners 2026
- ChatGPT Images 2.0 Review: I Cancelled Canva For This
- 50 Websites You Didn’t Know Existed (But Really Should)
Related reading: The Difference Between Social Media Marketing and Social Marketing (And .
Related reading: The 8 Reasons Most Blog Posts Never Get Found on Google (From an Audit o.
Related reading: Instagram Story Ideas That Get Replies (Not Just Views).
Related reading: How to Use ChatGPT for Content Creation (Without Sounding Like Everyone .
Related reading: How to Use ChatGPT to Create Photo Editing Prompts for Your Brand.
Related reading: How to Make Eye-Catching YouTube Thumbnails (Without a Design Degree).