


Follow Lilach
The Effective Reporting Automation Tool for Time-starved Marketers
Reporting is a vital part of a marketer’s job – and essential both to marketers and to businesses. Keeping track of your reporting can help you understand the ROI of your marketing spend, but perhaps even more importantly, it can help you understand what works and what doesn’t – so that you can optimize your marketing strategies and keep improving your results.
However, creating marketing reports is a time-consuming strategy; or at the very least, it is when you don’t leverage the right tech.
In a Gartner survey of marketing leaders, nearly half say their marketing analysts spend more time on data visualization and preparing data than actually analyzing the data (source).
You need a reporting tool that can prepare and put together all of your data effectively. Hence, you can spend more time analyzing to uncover valuable insights. But before settling for a tool, you need to consider these factors:
- Number of channels supported: a reporting tool that supports all the marketing channels you use means you can create all your marketing reports in one place.
- Automation: What automation features does a tool offer in terms of creating reports, updating it, and sharing it through email?
- Ease of use: A reporting tool needs to be so easy to use that you can create and schedule future reports within minutes.
In this blog post, discover how to spend less time creating reports, and more time uncovering valuable insights.
Effective reporting automation with Supermetrics
If you haven’t checked them out yet, Supermetrics is a very powerful analytics and reporting automation tool that can help you create and automate complex analytics reports in minutes, including multi-channel reports.
With Supermetrics, you can create reports for most of the marketing channels available today, as they have 60+ integrations. Also, using Supermetrics means you can have data from all these sources in one place, whether it’s a spreadsheet, dashboard or data warehouse. So, if you want to combine data from 2 or 3 sources (or even more!), you can easily do so. Better still, it’s easy to automate how you receive your reports or share them with clients.
Not to mention, they offer various templates that you can use to put together your reports in less than a minute.
Undoubtedly, this alone will save you hours weekly. But perhaps even more importantly, it will help provide you (or your clients) with a very clear picture of your marketing, SEO, social media, PPC and web analytics results, so that you can easily calculate your ROI (return on investment), see what’s working and what isn’t and discover the best way to optimize your strategies for better results.
Supermetrics has 5 main products that make reporting easier and more effective. In this Supermetrics review, we’ll be going deeper into Supermetrics for Google Sheets and Google Data Studio. That said, there are a lot of different products worth exploring, including Supermetrics for Excel and Supermetrics for BigQuery.
Supermetrics for Google Sheets
Copying data from various sources into Google Sheets is an ordeal no one looks forward to. Fortunately, by using Supermetrics for Google Sheets, you can get all your metrics in minutes.
To begin, you have to buy the tool or begin a 14-day free trial. Then, install the Supermetrics Google Sheets add-on – the whole process takes less than a minute.
Now, let me show you how easy it is to set it all up and what kind of data you can start pulling from your analytics.
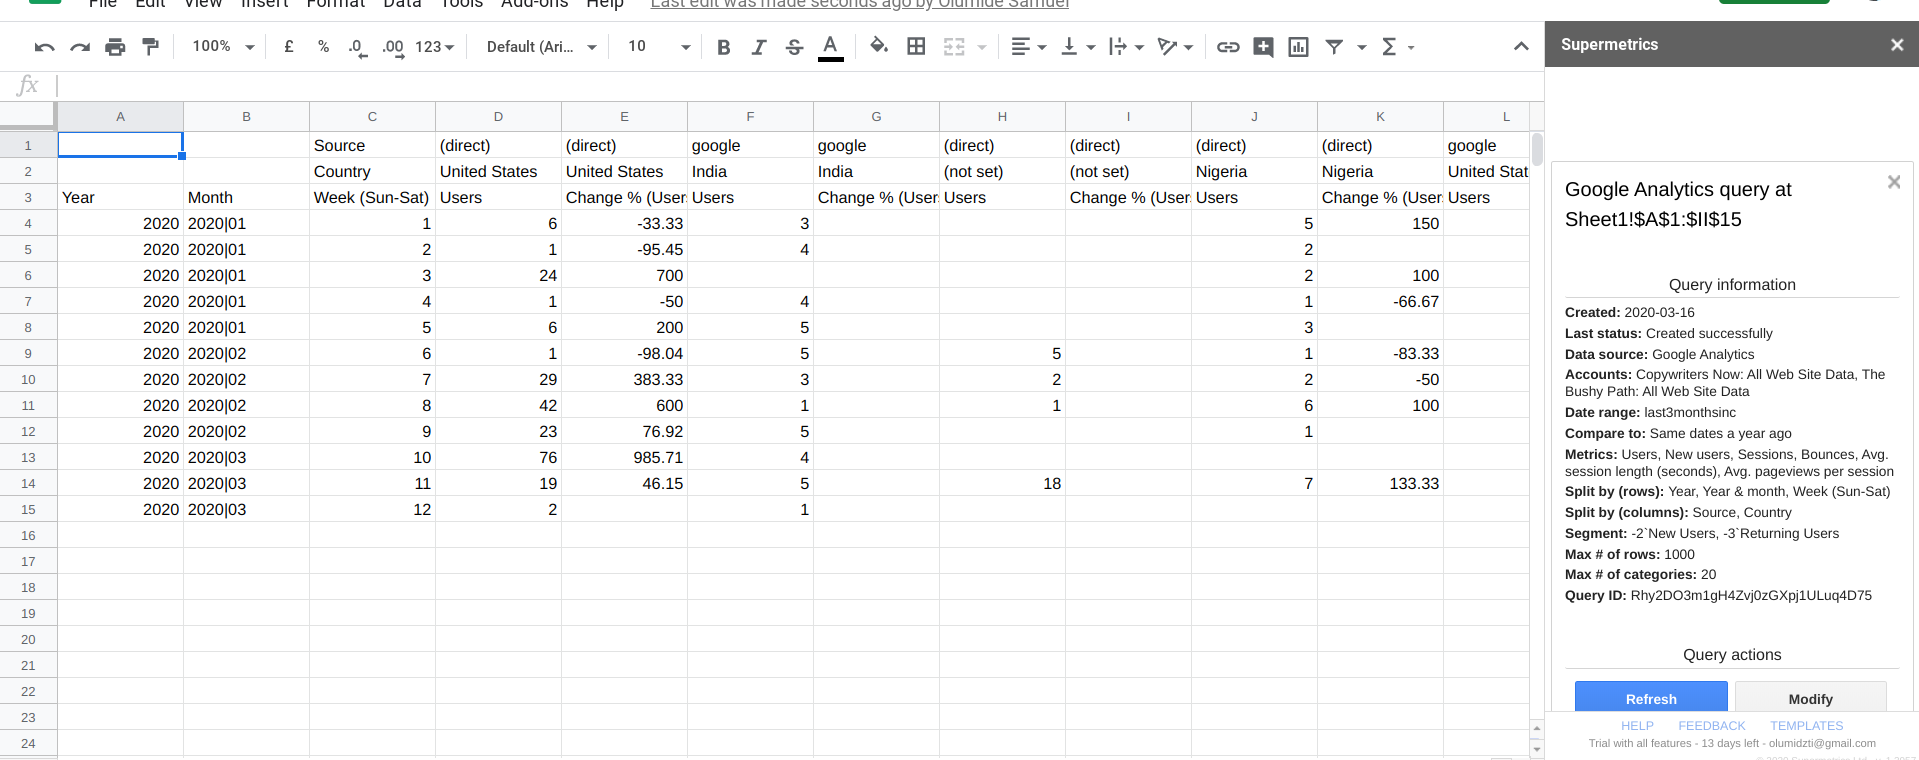
When you’ve set up Supermetrics, create a Google Sheet where you can add your reports from various sources. Inside your sheet, you can access Supermetrics through “Add-ons” at the top-left section of your page.
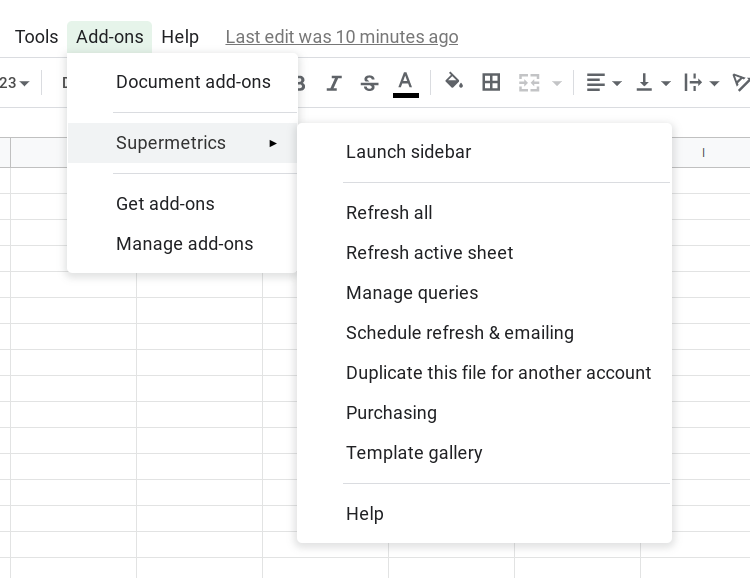
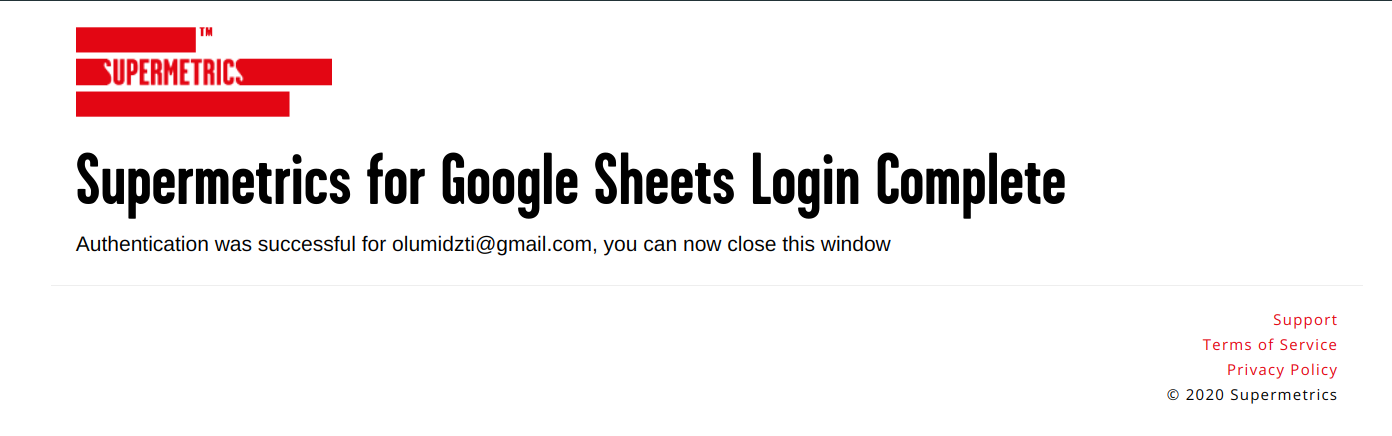
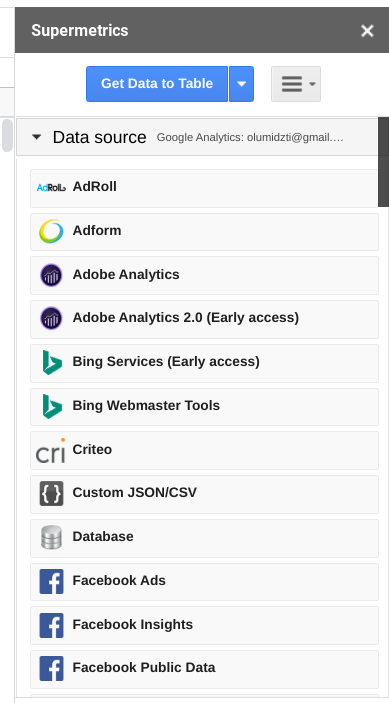
Click on “Launch” if you’re using the tool for the first time and fill in the necessary details. Here, I’ve selected Google Analytics as my data source. Of course, you have to log in to your data source to give Supermetrics access.
Once you’re done with that, you can launch your Supermetrics sidebar in Google Sheets.
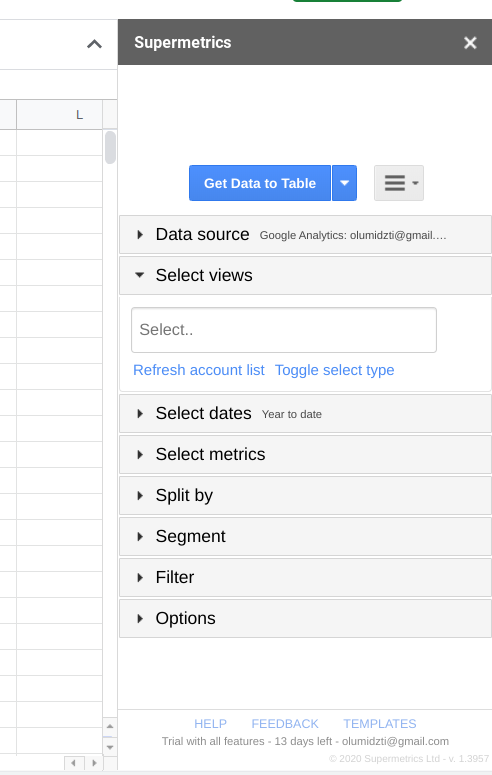
Apart from Google Analytics, there are over 50 data sources you can create reports for. Click on the “Data Source” drop-down and you’ll see them all.
After selecting your data source, the next step is to select your views. Considering that the data source here is Google Analytics, you can select the website you’re trying to create a report for.
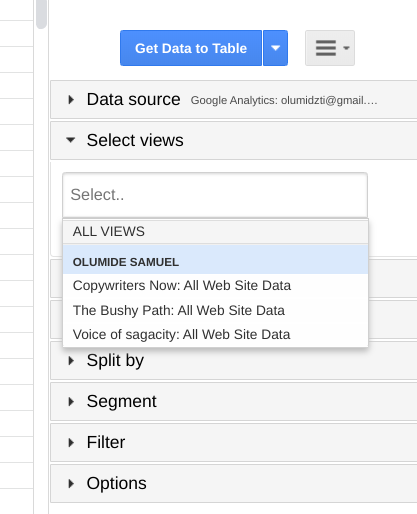
Another option is to view all website data in a Google Analytics account. The next step is to select dates for your report. Luckily, you have the option to select days, weeks, months, and even years.
You can also make a comparison of this period to last year or the previous period. Let’s say you took over a client’s account last year, you can compare the performance of the first quarter in 2020 to that of 2019.
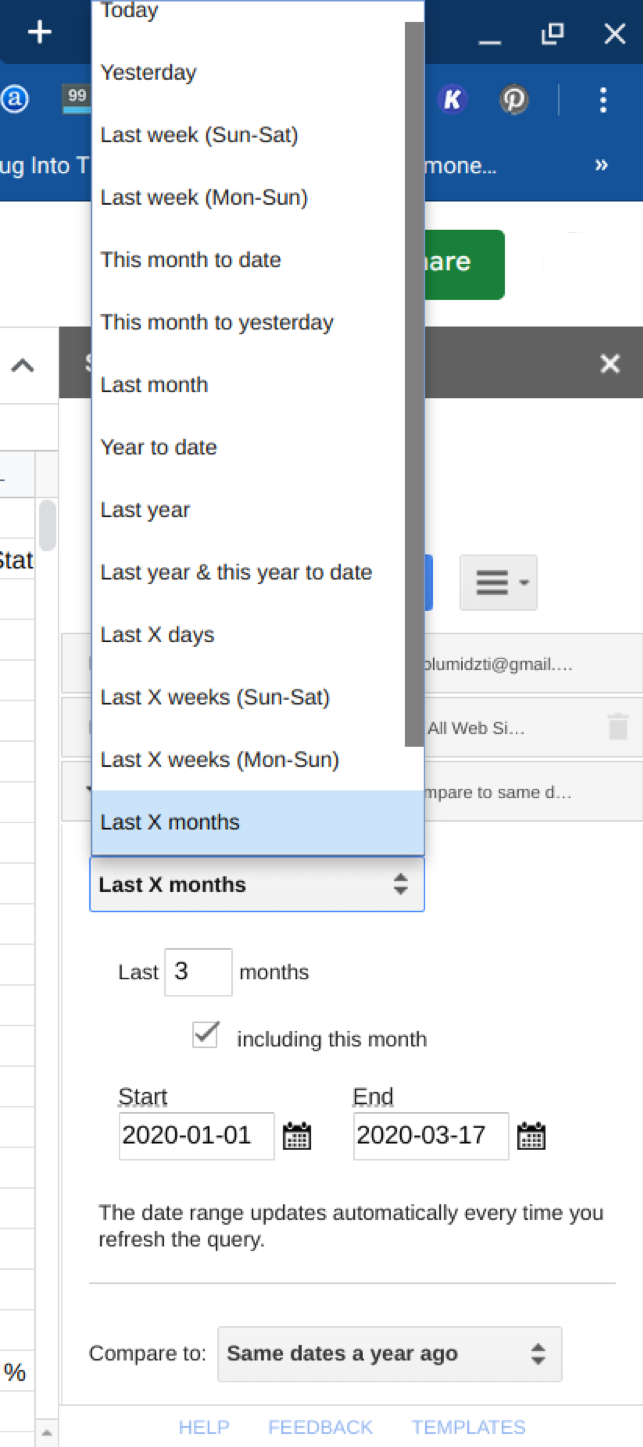
This way, you can show improvements through your hard work. Furthermore, you have the option to select specific dates.
When you’re done with this, the next step is to select your metrics. Depending on the goals for your marketing campaigns, you can select the metrics that represent your key performance indicators (KPIs).
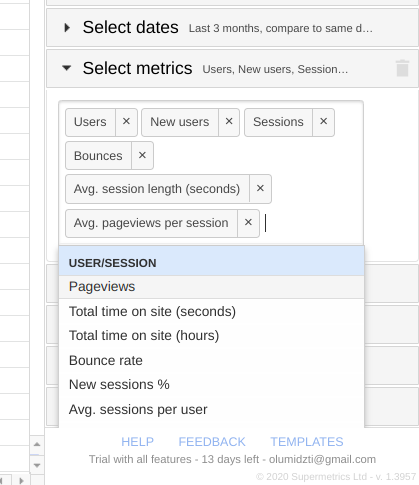
What really stands out about Supermetrics is that it can pull almost any metric and dimension that each platform has to offer. In other words, pretty much anything you need to know about your data can be pulled from the tools you use.
Why is that so important? Well, because most other tools in this space have very limited metrics that they can pull, which kind of defeats the purpose: after all, if you can’t include all the data you need from that specific tool, why even use a third-party tool?
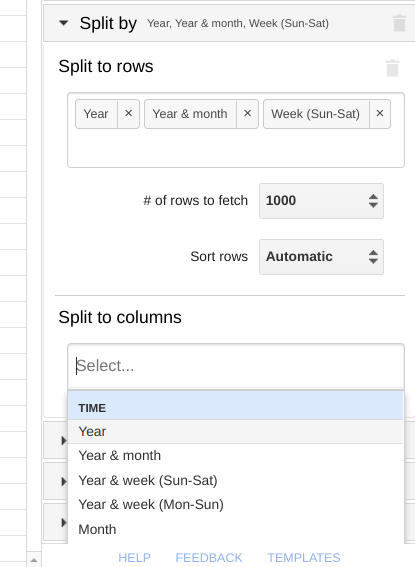
Below that, there’s the “Split by” option. Here, you can select the metrics to show up in the rows and columns. For the rows and columns, you have additional options to select the number of rows (or categories) to fetch and how to sort the rows.
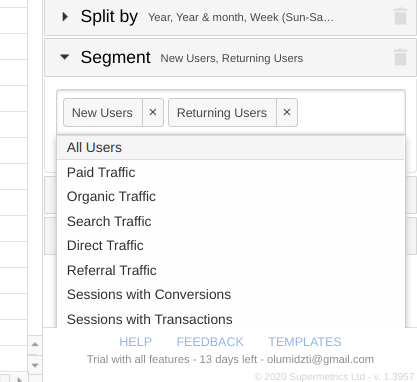
Below this, you can segment your audience. How does a particular segment of your audience perform in terms of your KPIs? You can also look at metrics for two segments of your audience. For instance, how do new users behave on your website compared to returning users?
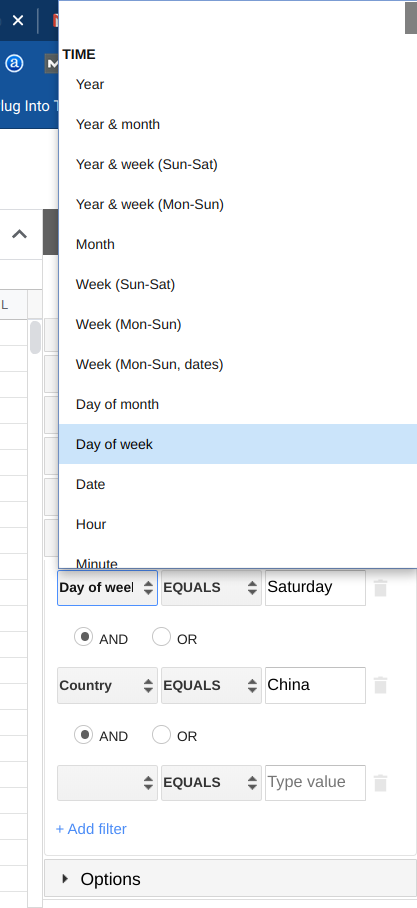
Another option you have is the “Filter” option. This allows you to create rules for your metrics.
Below this, you have options. These are more settings depending on how you want to display your reports.
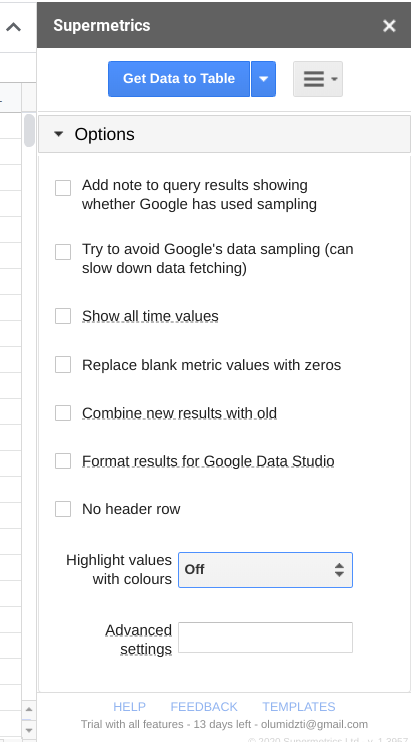
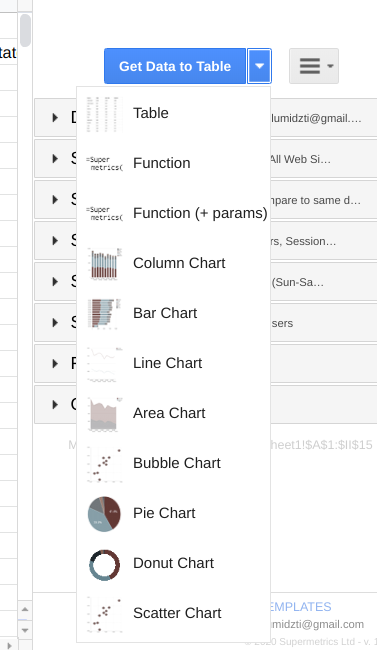
When you’re done with your settings, click on “Get Data to Table.” Then, Supermetrics will load these pieces of data on a table. Your table can be as simple or complex as you want it to be.
Also, you have the option to refresh or modify the data on this table. Having said that, there are other options to display your metrics other than a table. If you click on the drop-down beside the “Get Data to Table” button, you’ll find options to display your metrics such as column chart, bar chart, and others.
And perhaps most importantly, you can blend data from multiple sources with their multi-channel reporting features.
This is something that marketers and businesses who want to see a full picture of their marketing efforts across channels, will surely appreciate.
The multi-channel reporting feature essentially means that you can pull together data from multiple sources; to give you an example, if you wanted to see both your social media advertising metrics and results, together with your Google Analytics data, you can easily do so with Supermetrics.
This way, you’ll have a much clearer picture of how your marketing efforts are paying off and what your actual ROI (return on investment) is.
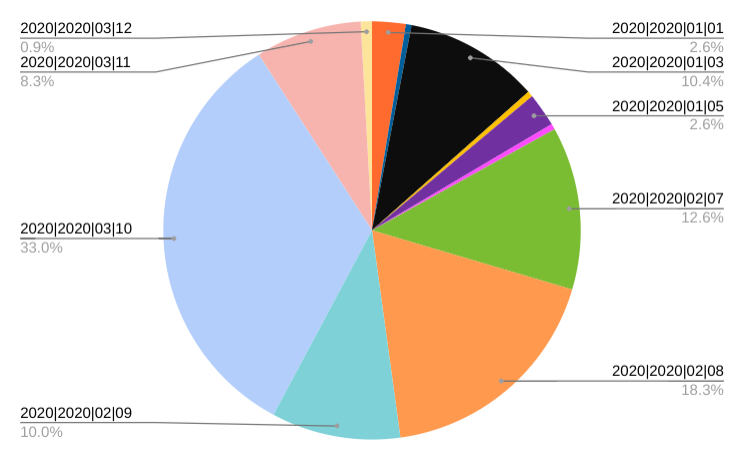
For example, the pie chart view looks like this:
Creating your reports for the first time may take time. However, Supermetrics provides more options so that you need much less time to get this report after the initial set up.
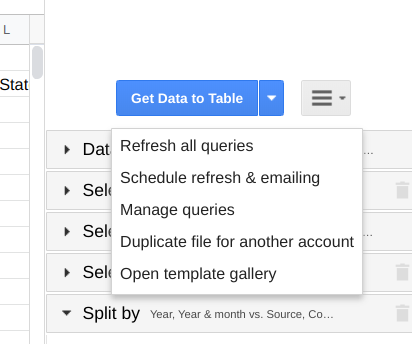
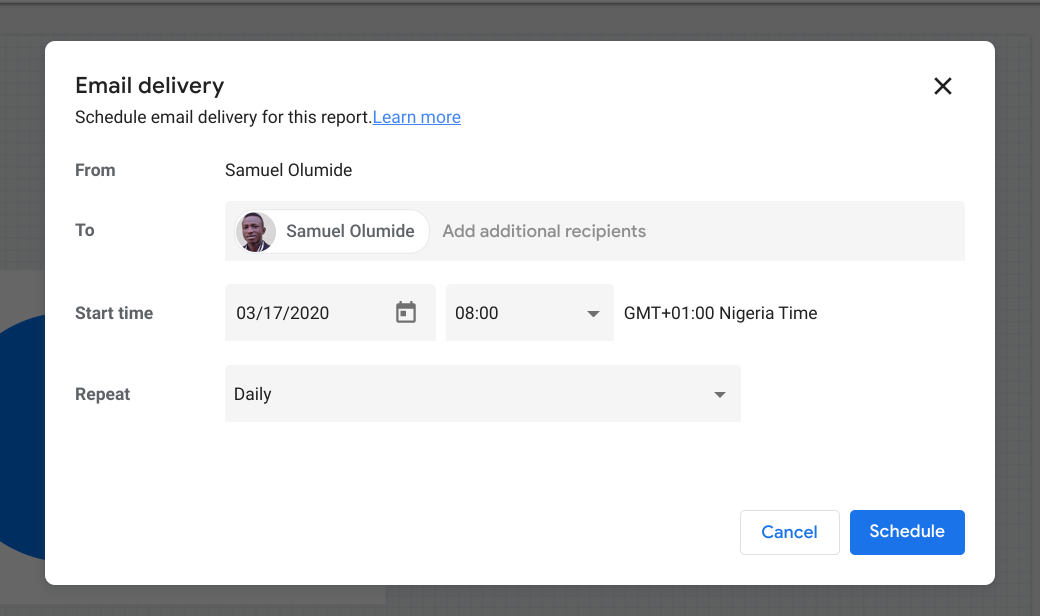
First of all, you can refresh the queries manually. Another option is to schedule refresh and emailing. This way, you can create an important report and get updated figures in your email at intervals. More so, if you have clients, you can schedule reports to be sent to their email addresses at intervals.
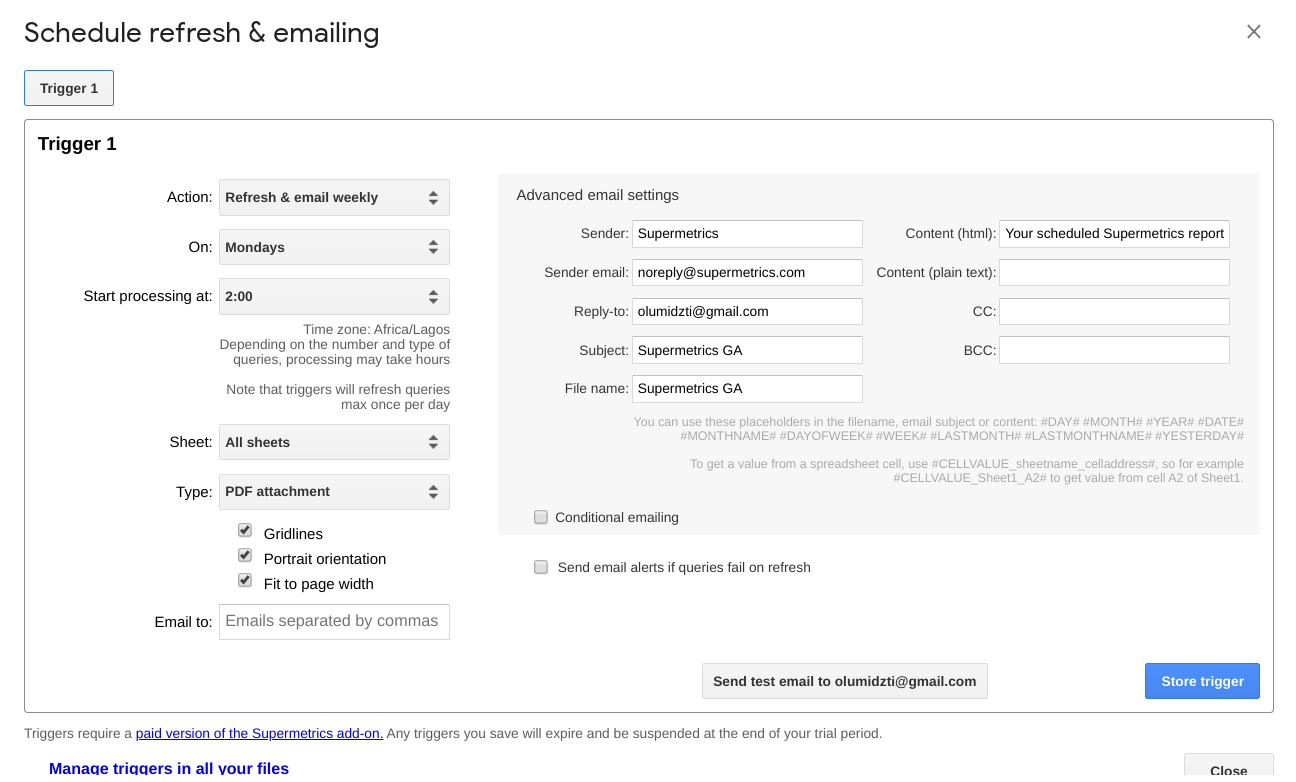
Here, you can set up refresh and emails. This gives you enough flexibility depending on your preference. Another option you have is to manage queries.
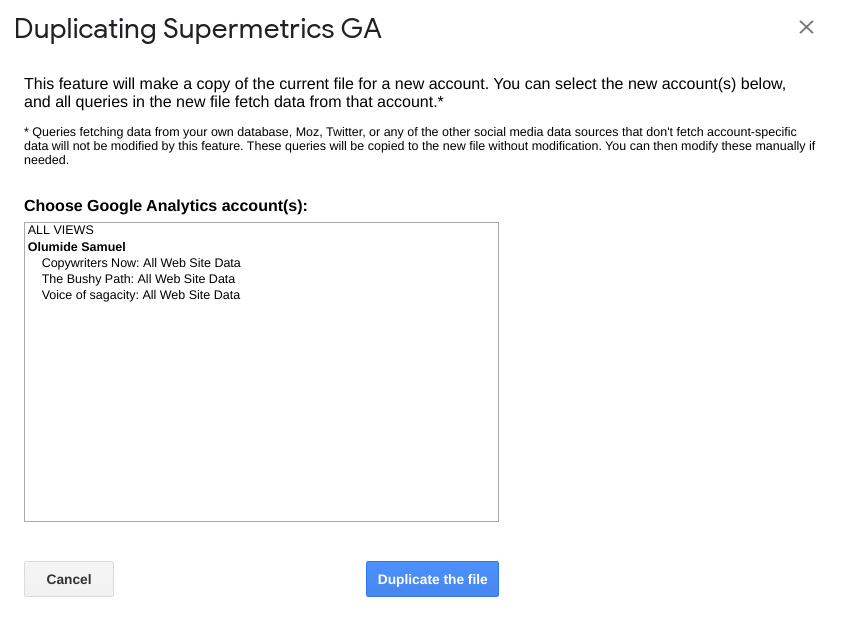
One way Supermetrics makes reporting easier is the ability to duplicate a report for another account. So if you want to run a report for all of a client’s website, you can create the report for one website and duplicate it for the others.
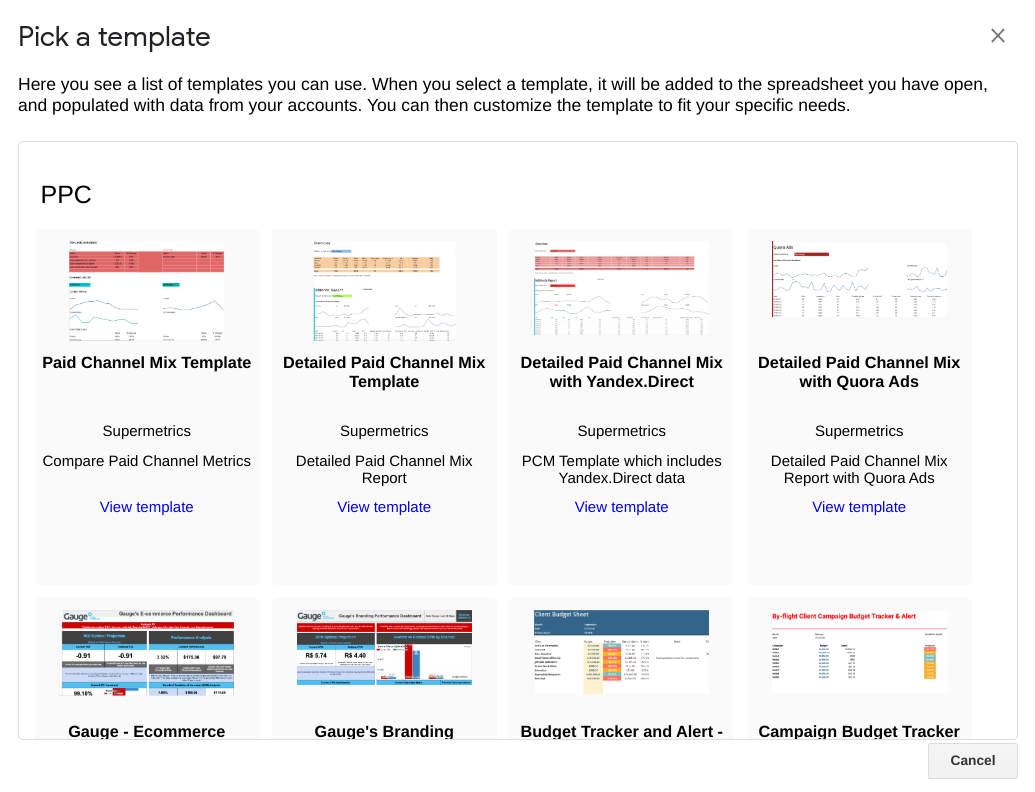
Let’s face it, very few marketers can design beautiful or even passable reports. So it’s a relief that Supermetrics provides templates to make your reports look professional. Luckily, these templates are created for different needs such as PPC, Analytics, SEO, and social networks.
Even though this process is for Google Analytics, you can repeat it for more than 50 marketing channels. Undoubtedly, with Supermetrics for Google Sheets, you can create your reports, schedule them for automatic delivery at intervals, and save a lot of time and stress.
Supermetrics for Google Data Studio
If you want to create beautiful reports, Google Data Studio is one of the best platforms to do so. However, Google Data Studio only supports Google services such as Google Analytics, Search Console, Google Ads, Google Sheets, YouTube, and others.
To find a way around it, marketers import data from other channels using Google Sheets. Fortunately, you now get a straightforward solution with Supermetrics for Google Data Studio.
There are over 45 connectors that you can use to create reports on Google Data Studio. You can either buy any of those connectors or try for free for 14 days. Once you select a connector, you’ll have to authorize the app to get your details onto Google Data Studio.
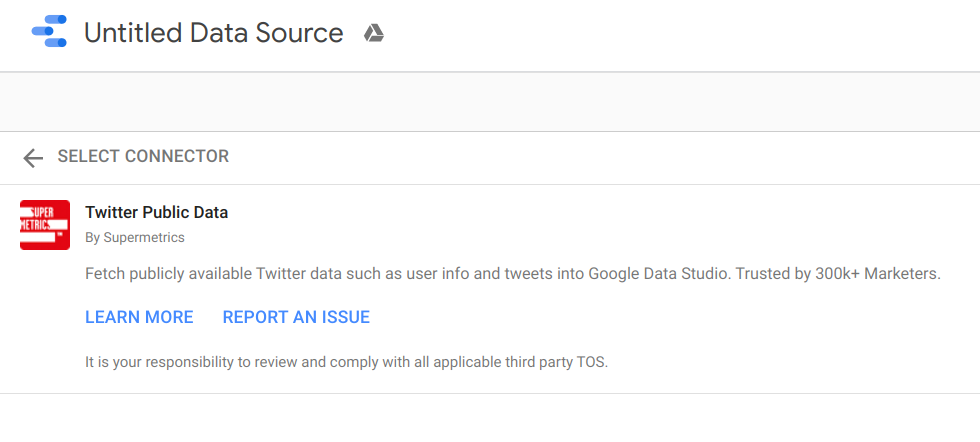
After connecting Twitter public data, I can now create a report on Google Data Studio using Twitter account metrics. In another sense, you can use one of Google’s templates.
All you have to do is click on the template and click the “Use Template” button on the next page. When you do that, you’ll have to select your data source which is Twitter data in this case. After that, click on “Copy Report.”
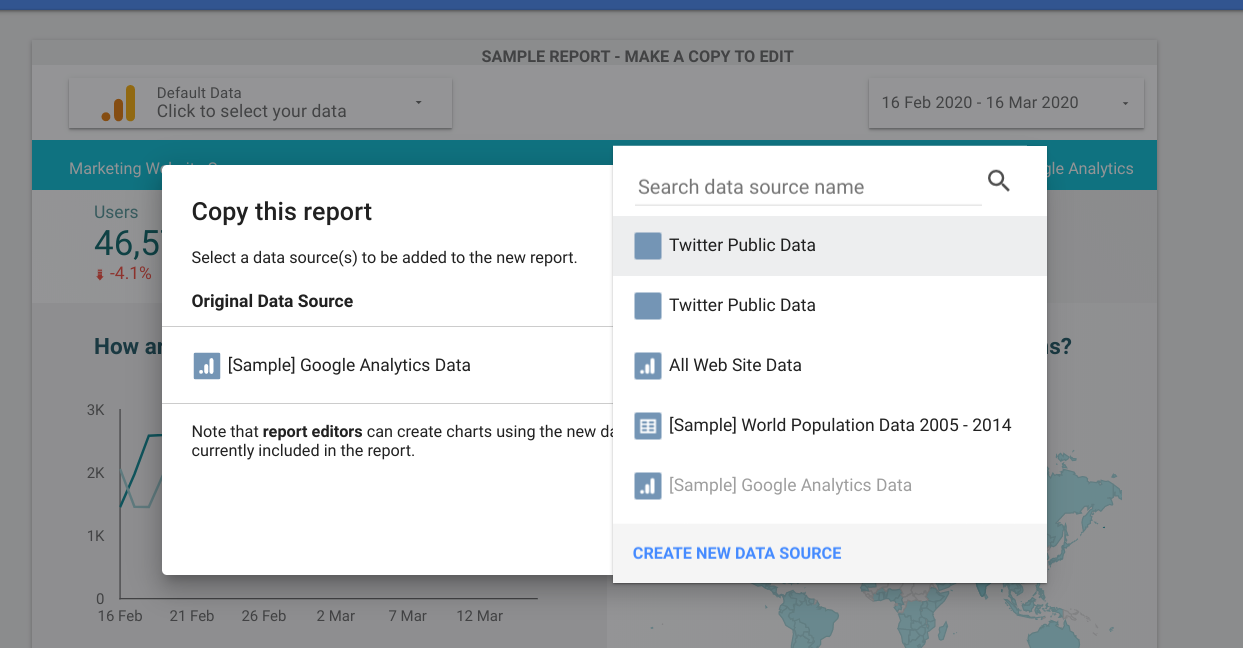
When you’re done creating your reports, you can download the report, embed, or schedule an email delivery to your client’s email address. Also, you can invite other people to work on the report.
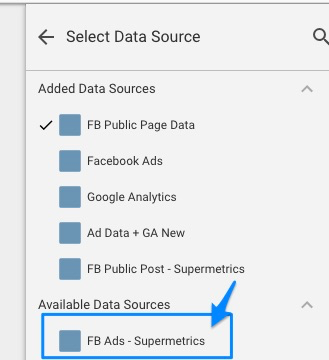
The beauty of this is that Supermetrics allows you to add more data sources using the connectors. This means you can create your reports for Facebook ads, Twitter ads, LinkedIn Ads, Shopify stores, and others – or, you can create reports using data from multiple platforms.
From these data sources, you can create different reports and schedule email delivery. Just like on Google Sheets, Supermetrics for Google Data Studio helps to create reports easily. Even better, you can create more beautiful reports here.
Customer support
With the number of tasks to execute on Supermetrics, you might need help in some situations.
Supermetrics provides 3 options to find solutions to issues you might face while using the tool. First, there’s a support page where you can find articles about the solutions Supermetrics provide.
For example, Supermetrics for Google Sheets has 48 articles while Supermetrics for Data Studio has 34 articles.
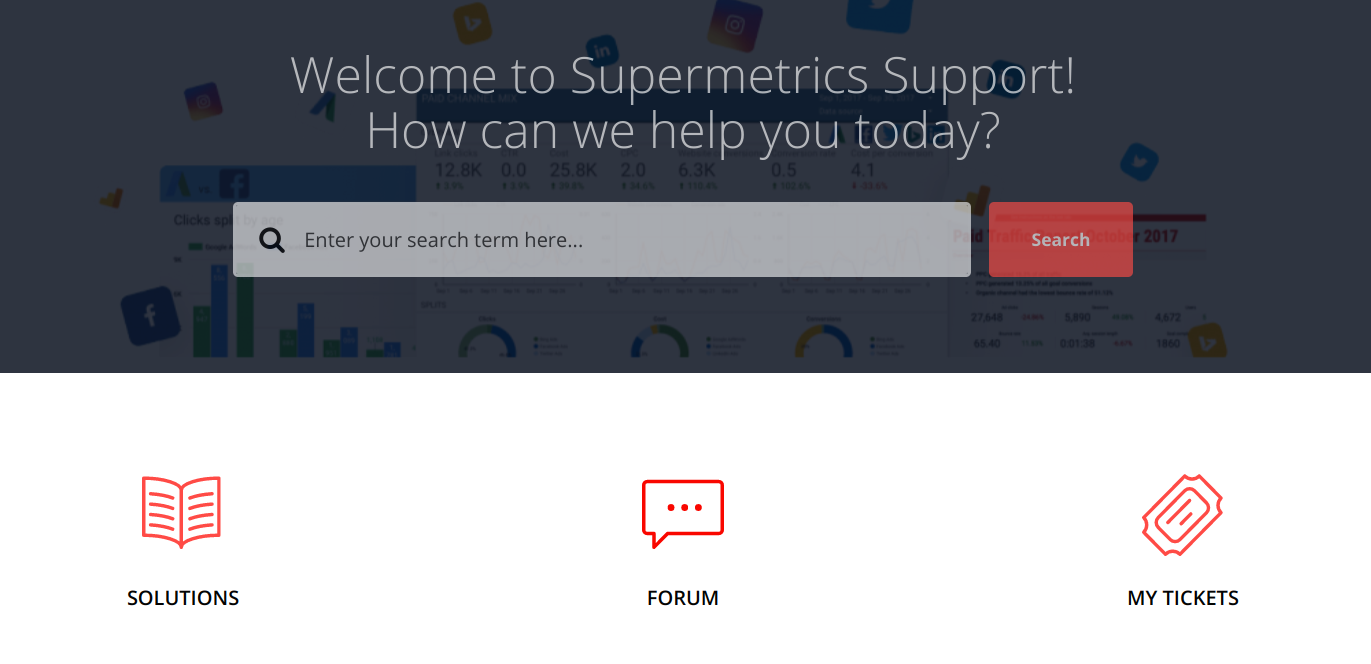
In most cases, you’ll find the answers to your queries here. Otherwise, you can submit your questions to the Supermetrics forum where other users and Supermetrics customer reps will reply.
If you can’t get your answer on the forum or want to stay confidential, you can submit a ticket to the Supermetrics team providing details about the issue.
Conclusion
Reporting is a vital task for any marketer. And it takes a lot of time to collate all the data manually.
Luckily, Supermetrics has features that make it so much easier to get your data and create beautiful reports. But there are many different reasons why I’m loving this tool so much and why I think it stands out amongst the rest; most notably:
- Multi-reporting: you can combine data from any source you want (from online ads to Google Analytics and to SEO data)
- It works with pretty much any data source you’re using: with over 60 different integrations available, you’re hard-pressed to find a data source that you can’t add to your reports!
- It can pull any data you need it to – this is something that most similar tools can’t do as they’re very limited in the types of data they can pull from each source
- It’s all automated – it saves you so much time putting together your reports!
- It’s super easy to use and features various pre-made report templates so it can literally take seconds to put together and automate a report
Take advantage of the 14-day free trial (for each of their products) and see what Supermetrics can do for your business.

Follow Lilach