

Follow Lilach
The most effective way to improve the user experience and convert more visitors
Wondering why your website visitors aren’t converting into customers?
Building a successful online business requires many different elements: the quality of your products or services, your marketing strategies, your SEO…
But perhaps most important of all is your website.
After all, it doesn’t matter how much traffic you’re getting to your website if that traffic isn’t actually converting.
Ideally, you want your visitors to spend a lot of time on your website, visit multiple pages in one session and keep coming back for more.
And what’s more, you want them to move through your funnel, easily, and convert into customers.
The only way you can build a website that converts is by improving the overall visitor experience on your website. And in order to improve the overall visitor experience, you need to know what’s keeping people from converting, what’s causing problems during their visit to your website and what’s working – and why.
And the truth is that while we have lots of useful analytics tools at our disposal, such as Google Analytics, they only really tell you what people do (or don’t do) on your website – for example, how many clicks each element gets – but they don’t tell you what’s causing your visitor problems.
In this blog post, discover why your website visitors aren’t converting into customers and the most effective way to improve your website’s user experience.
How do you start optimizing your website?
In order to optimize your website, there are 2 main options you can take: you find out what’s keeping people from converting and then find ways to fix those issues or you perform numerous A/B tests to discover which versions of your pages perform best.
Thankfully, getting data about your website visitors’ user experiences is easier than ever using website heatmap tools.
Recently, I tried out
It’s truly opened my eyes as to how my visitors interact with my website – and what I have to do to improve their user experience and get more of these visitors to convert. Because while I’ve used a lot of analytics tools – if you’re a loyal reader, you’ve certainly noticed that about me! – Mouseflow is something completely different from all those analytics tools, helping me get considerably more insight into my website visitors.
So I really want to show you as well how it works and what you can achieve with this tool.
As I mentioned earlier, if you want to improve your website conversions, then you need to know what’s keeping your visitors from converting – if their user experience is smooth, if there are elements that cause frustration if there are any important elements – such as calls to action – that they can’t see properly…there are many things that could – and likely do – go wrong.
And there really is no such thing as a perfect website; creating a great website is a continuous journey that requires us to change and optimize websites based on customer profiles, behavioral changes from website visitors and design trends.
But if you want to take your website from OK to amazing (in terms of performance, of course!) then you need a tool to help you see what you’re doing wrong and how you can change it.
And that’s where Mouseflow comes in.
[click_to_tweet tweet=”The most effective way to improve the user experience and convert more visitors using @mouseflow #conversion #businesstips” quote=”The most effective way to improve the user experience and convert more visitors using @mouseflow #conversion #businesstips”]
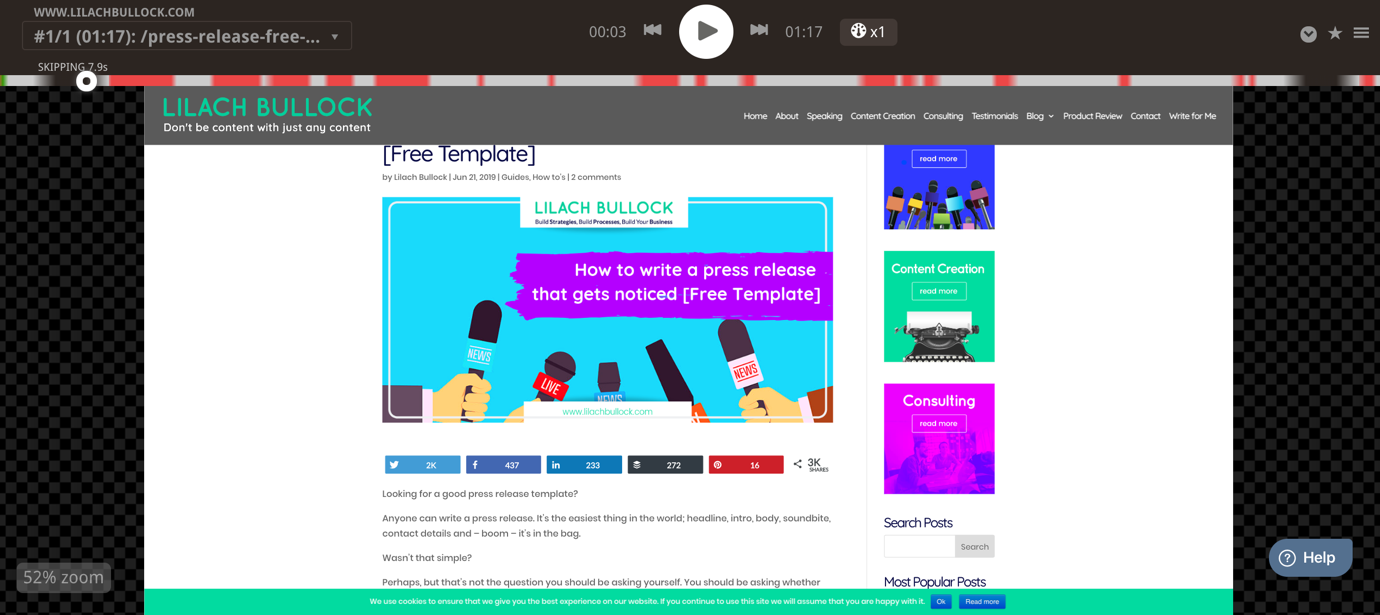
Once you’ve installed Mouseflow on your website – and it’s super easy to do, all you need is to copy a code on your website – the tool will start to automatically and promptly record your visitors’ activities on your website:
- See complete recordings of your visitors’ interactions on your website, from start to finish:
- See heatmaps for clicks, movement on page, scrolling, attention and even geographical heatmaps to see where people are visiting your website from
- Create sales funnels so that Mouseflow can track how visitors drop out or convert, or create funnels on other calls to action you might have on your website; you can then use this information to improve your funnel and make sure that the entire experience goes as smoothly as possible for your visitors
![]()
- Track how users interact with your forms – you can see very clearly how visitors engage, what form questions they abandon, what makes them not finish completing the form and all this type of information that you need in order to optimize your website’s forms
- Ask for feedback from your visitors directly so that they can tell you, easily and conveniently, if they’re having any issues with your website and if they’re struggling in any way
How to boost your conversion rate using heatmaps and visitor recordings
One of the best things about Mouseflow is that it’s not just focusing on pageviews and heatmaps but actual full session recording of what your visitors are up to.
You can essentially follow your visitors from the moment they jump on your website until the moment they abandon it.
In other words, you can track the whole visitor journey to help understand why you’re losing visitors and where through the use of full-screen recordings and detailed heatmaps.
And before you panic that you have to go through each recording and understand why people are leaving your website, it’s actually much easier than you might think: Mouseflow uses AI/machine learning to understand the data from your recordings and therefore help you understand what areas of improvement you need to look at.
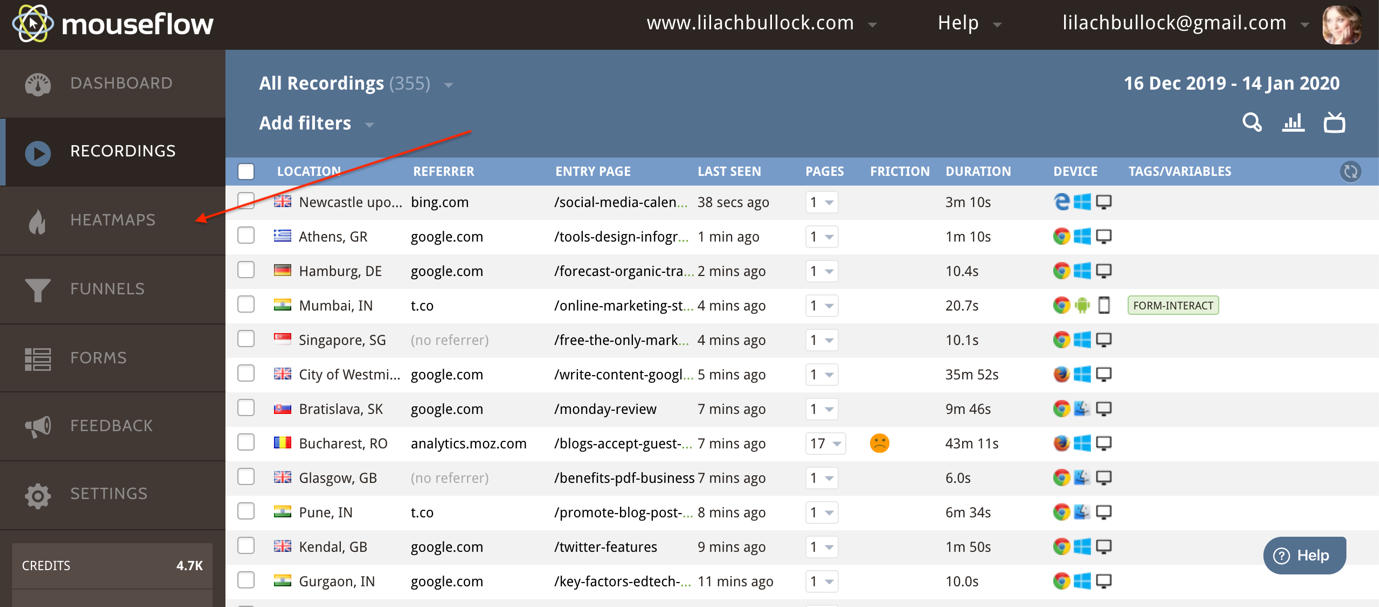
Once you’ve created your Mouseflow account and added the code to your website, the tool will automatically start recording your visitors’ interactions; you’ll be able to see all of them listed out in the Recordings section:
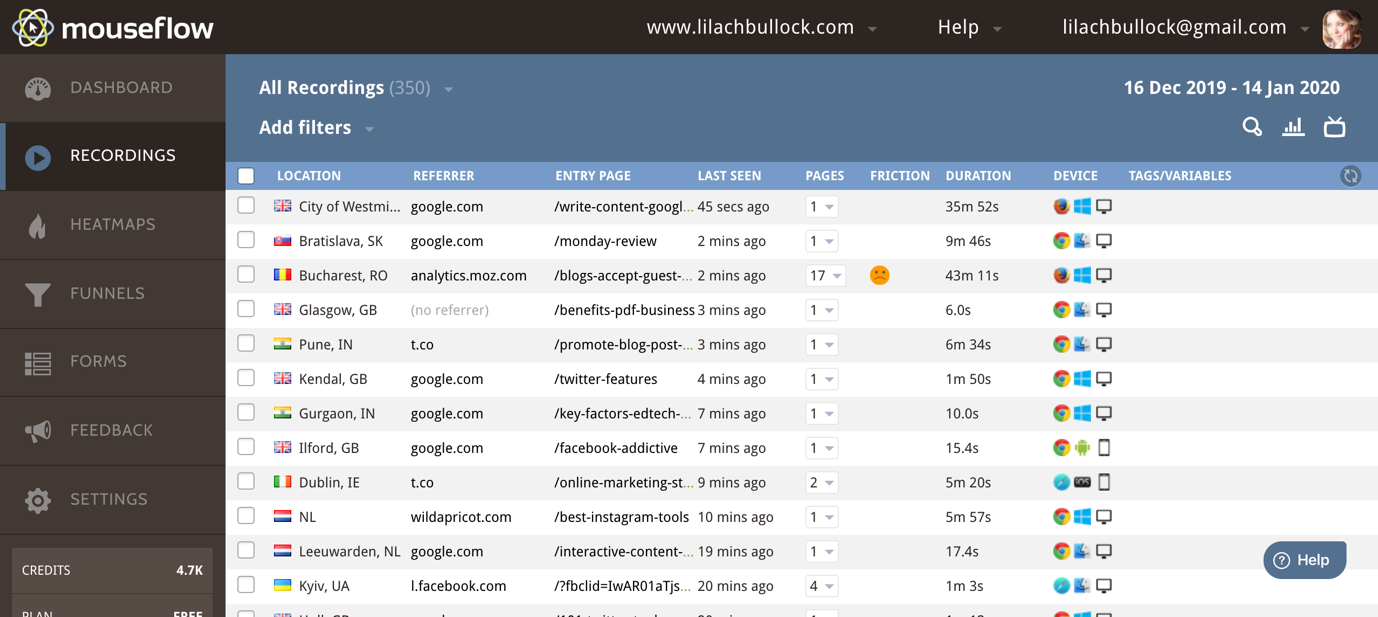
As you can see above, you get a lot of information at first glance:
- The location of the visitor
- The referrer (unless they’re visiting your website directly)
- What their entry page was and how many pages they saw during their visit
- How long they spend on your website
- What devices they used to visit, including what browser and what OS they have
- And if you click on the Play button (as evidenced in the above screenshot) you can replay their entire visit from start to finish
You can also take all kinds of actions for individual visitors:
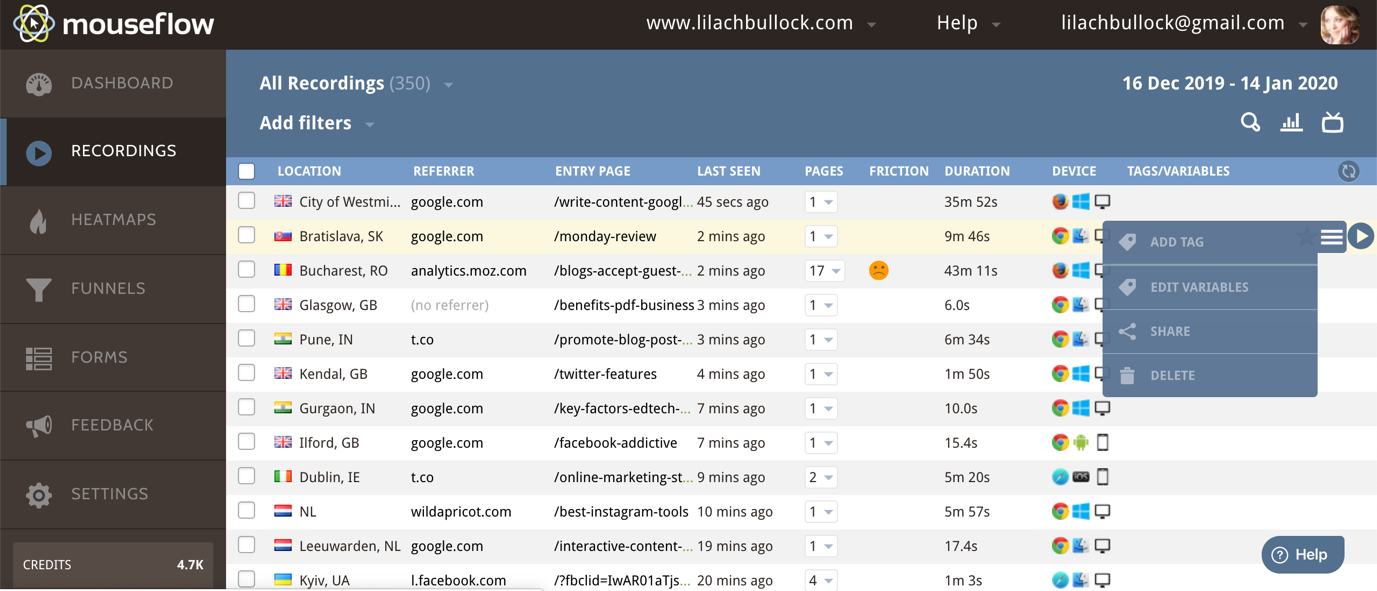
As you can see above, you can add tags to help organize them, identify the visitor in more detail, download the recording for safekeeping and other similar actions.
You might’ve noticed in the screenshots so far that there is a separate tab for tags/variables; here, the tool will automatically pull up any campaign tags if there are any:
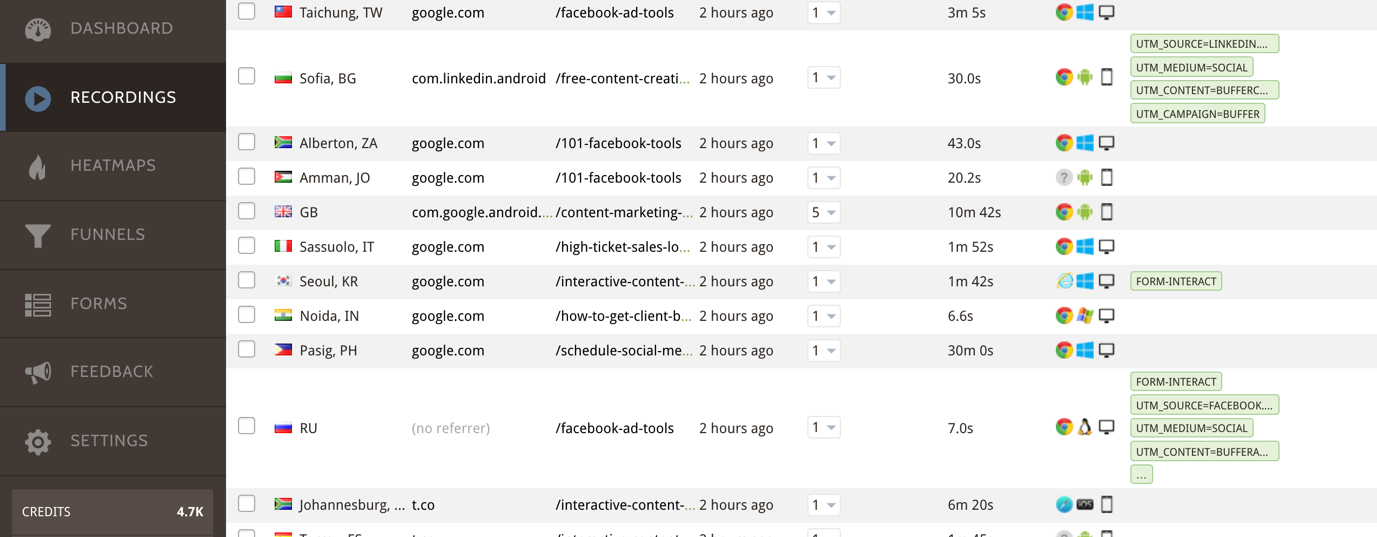
In other words, if you have a social media campaign where you’re using UTM links to promote your content, for example, those will be automatically added to that tab. Alternatively, you can also add tags yourself for easy organizing.
As you might’ve noticed above, it’s not just UTM tags that are automatically picked up, but also interactions with forms from your website.
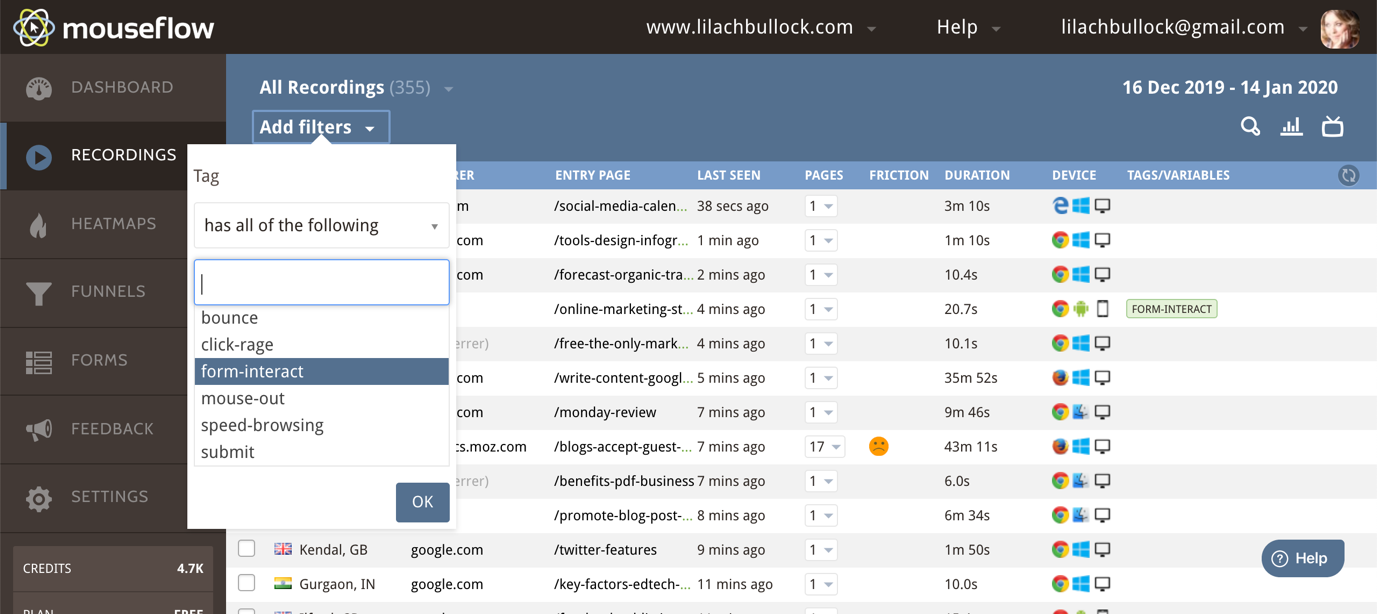
One of the best features here though, in my opinion, is the extensive filtering option:
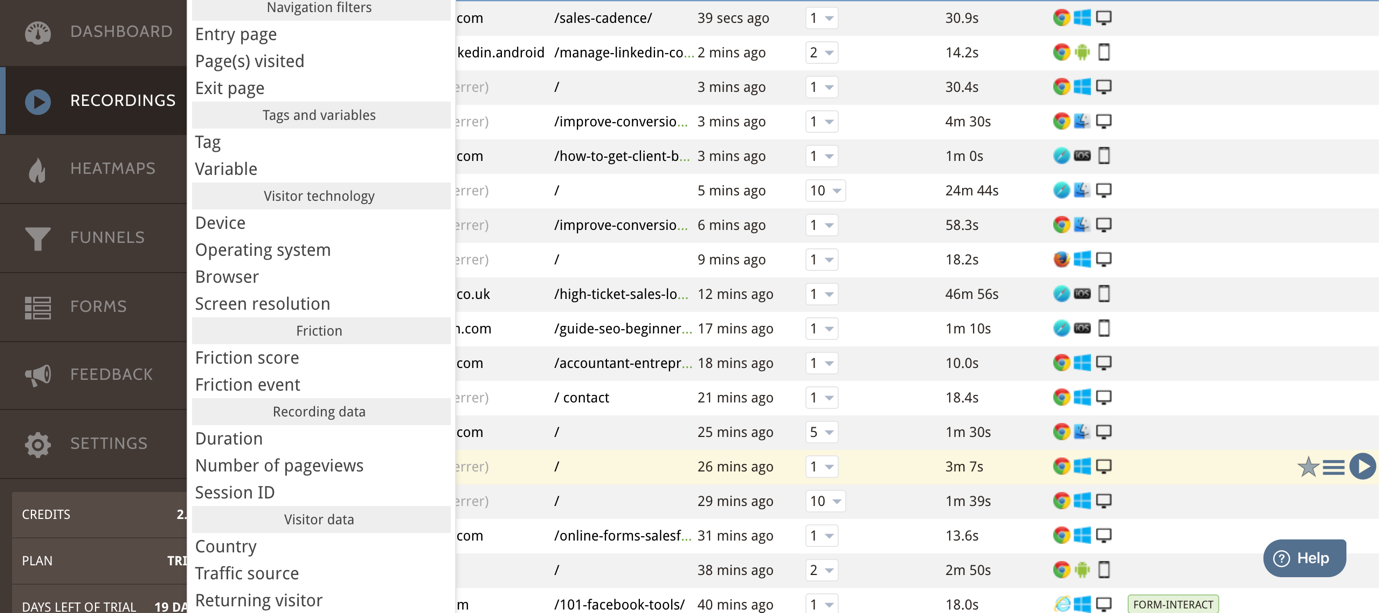
As you can see above, there are numerous filters you can select to find the specific types of recordings you want to find; for example, you might want to see how a specific campaign is performing. In that case, you’d filter your results by Tag to see only the recordings with those tags.
You can then check how that campaign is converting and particularly, how users are interacting with that campaign’s landing page.
Are they seeing your call to action? Are they spending enough time on that page? Are there any important elements on your page that aren’t as visible as you thought?
Or, you might want to see what the browsing experience is like from a specific device, such as mobile. Likewise, you can filter out the rest of the recordings so you can only check the ones from that specific device you wanted. This will tell you if your website looks and performs as you’d want it to for that device or if you need to further optimize it.
Another very useful element here is “friction”; friction relates to any events that are keeping your website visitors from having a good browsing experience.
This will tell you what problems, specifically, your website has.
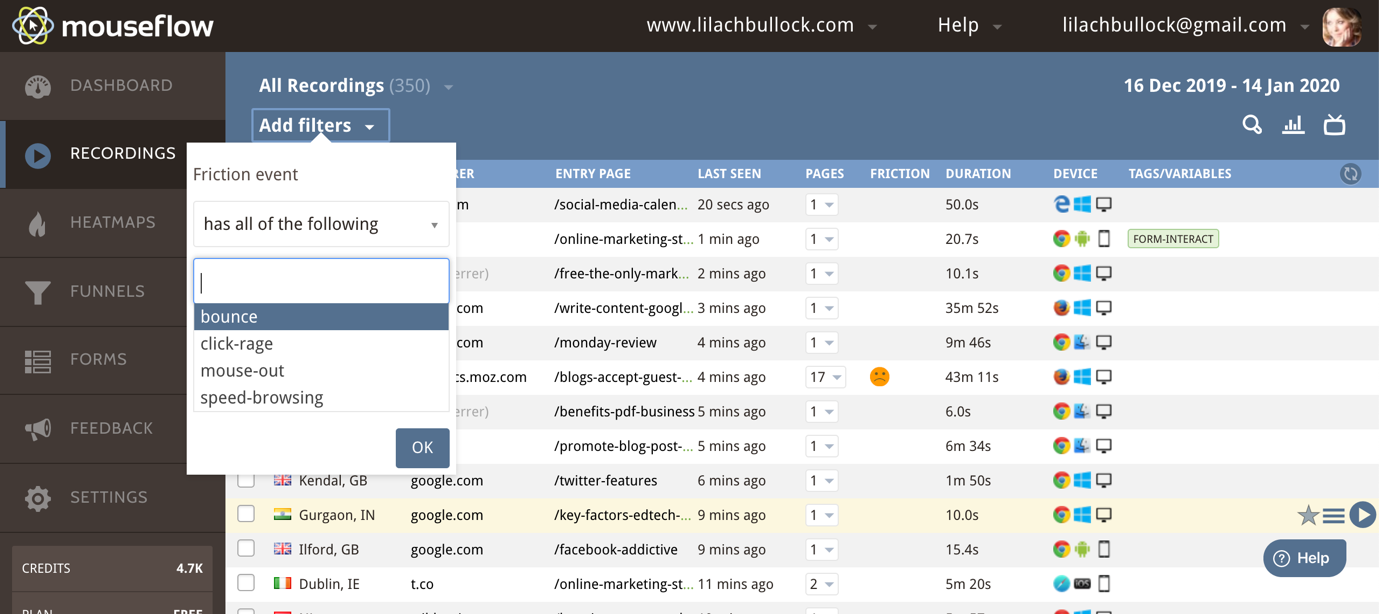
For example, one option is to search for any recordings where the visitor encountered a “friction event”; as you can see above, that can be bouncing from the page, a click error, a click-rage (i.e. when you click numerous times in succession if a button/option isn’t working as it should) and other similar errors that would make for a sub-par browsing experience.
The other option is to use the Friction Score filter:
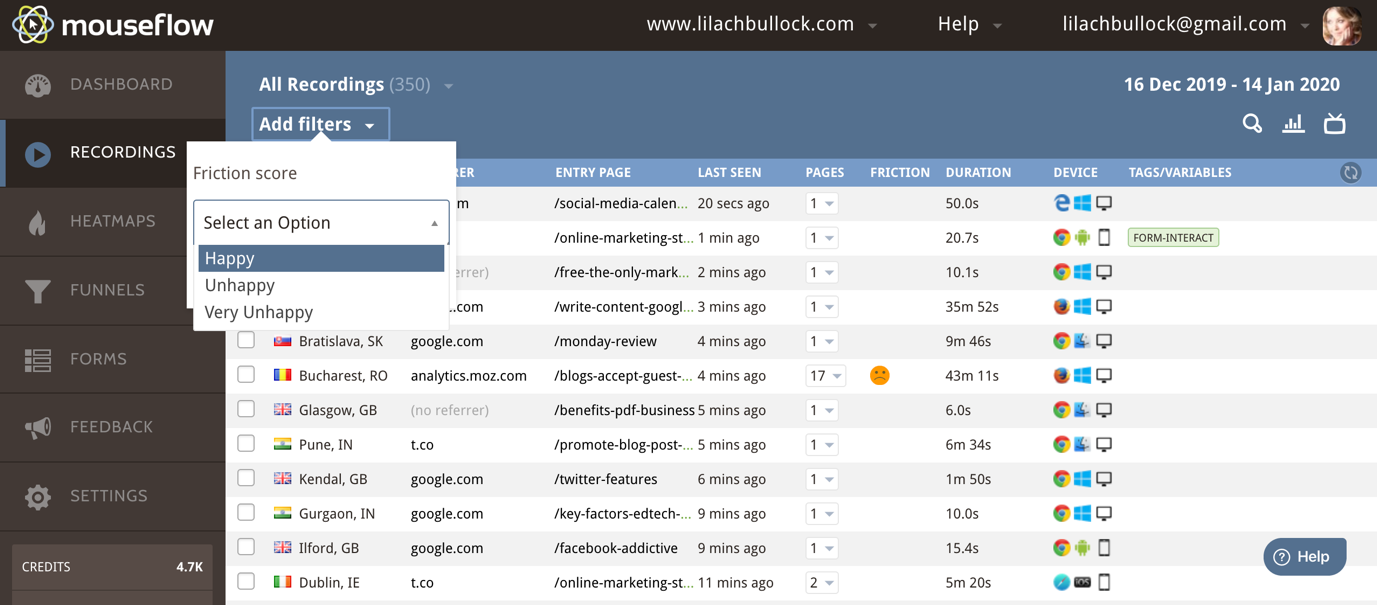
Mouseflow automatically adds a “friction” score to your visitors’ recordings and will automatically point out any experiences that had a high friction score (as you can see in the above screenshot, the recording that has a red unhappy face next to it).
You can filter your recordings so you can only see unhappy or very unhappy visitors; then, like before, you can see why they had issues, what made them frustrated and you can then find out what you need to do in order to sort out those issues.
Another way to leverage the filtering options is to check all of the recordings of people who interacted with your forms:
This is very interesting to me because not all the people who interact with forms actually submit them.
This then allows me to see how people are interacting with the various forms on my website and what I can do to increase the number of form conversions.
As you can see, you can get a lot of value from these recordings, especially thanks to the extensive filtering options; otherwise, it would take you entirely too long to go through all of your visitor recordings.
But this way, you can find exactly what you’re liking for in literally seconds. It allows you to focus on your website’s actual problems, as well as conversions – which after all, are the most important things to do when optimizing your website.
Moving along though, there’s another hugely beneficial feature: the heatmaps.
As you can see above, there are several types of heatmaps you can access, most of them pretty self-explanatory:
Click heatmaps
Click heatmaps let you see how people click on your pages, which is very useful for optimizing the navigation and the buttons on your website:
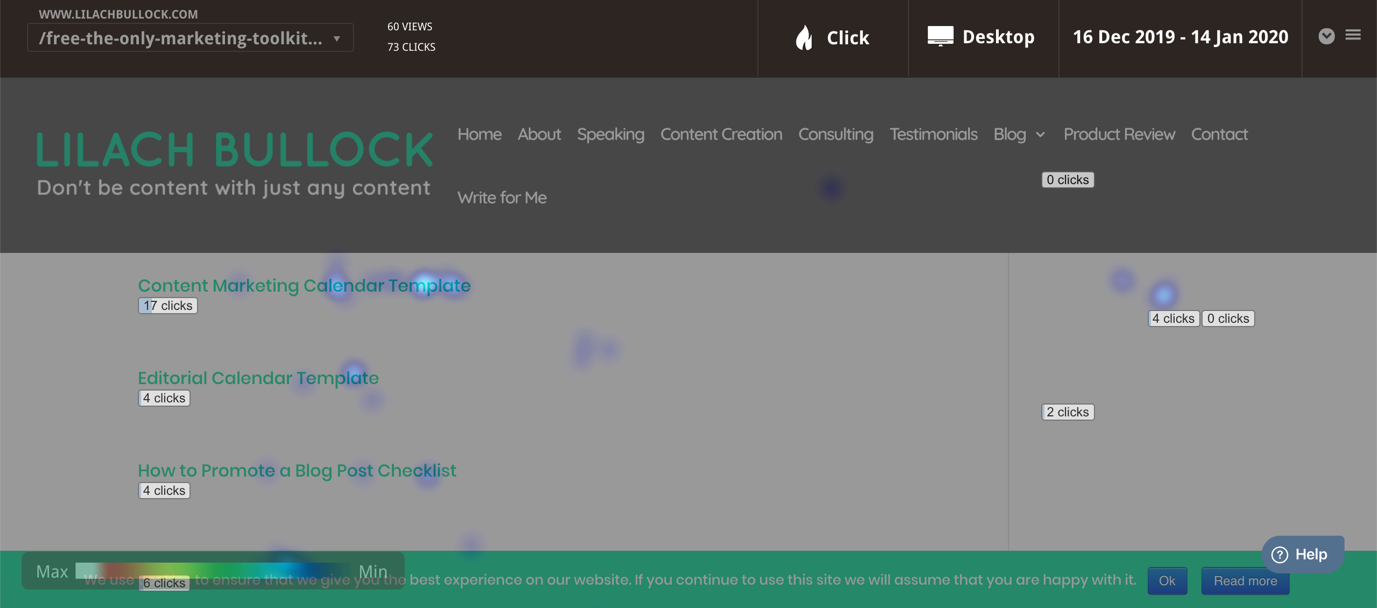
As you scroll down the heatmap, you can see which elements are being clicked on and which aren’t.
This screenshot is for desktop devices; if I click on Desktop I can then change it to see clicks from all devices or from a different device (phone or tablet).
This can tell you where to move elements that you want people to click on so that they’re more visible, change the location of your calls to action, or move the most interacted-with elements further up on the page.
And if I hover my mouse over Clicks, I can select a different type of heatmap to further understand how users interact with my website.
Movement Heatmap
The Movement heatmap lets me see how people are moving on my pages:
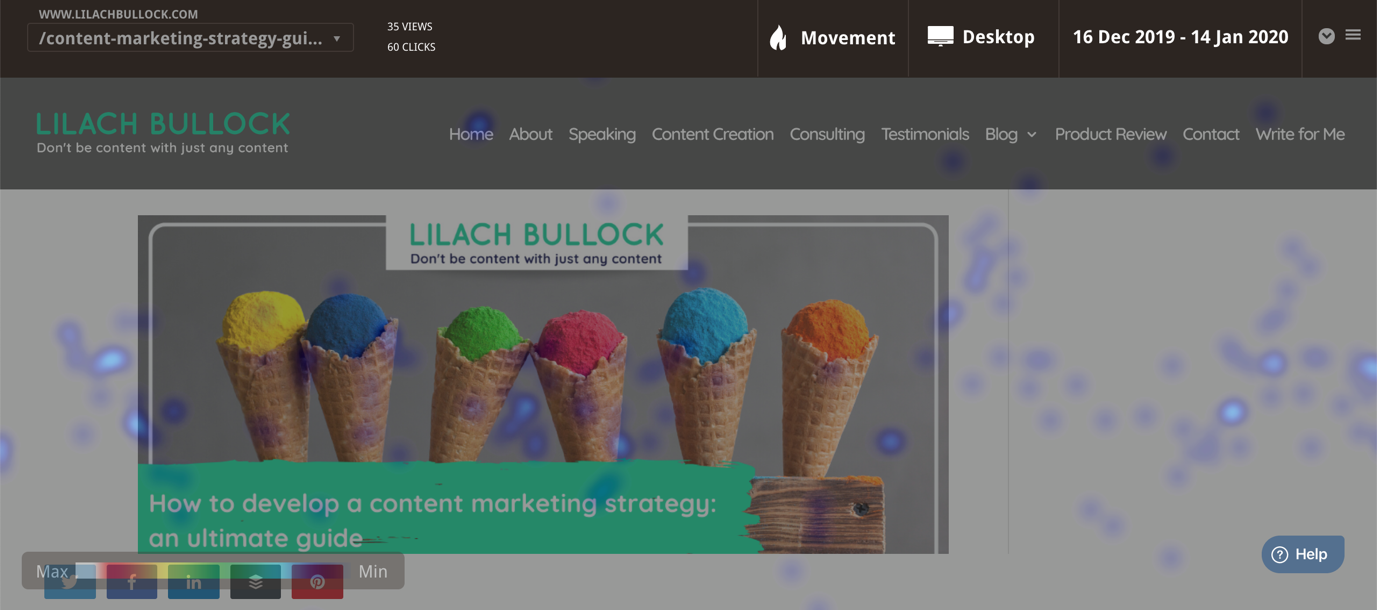
The “hotter” a colour is – i.e. the closer it is to Red – the more people are “moving” in those areas.
As with the previous heatmap example, this can tell you what elements need moving or changing on your page, depending on your end goal.
Scroll heatmap
How much of your page do people actually see?
This is a very valuable tool as it lets you see exactly how many people are actually scrolling through your pages and seeing more:
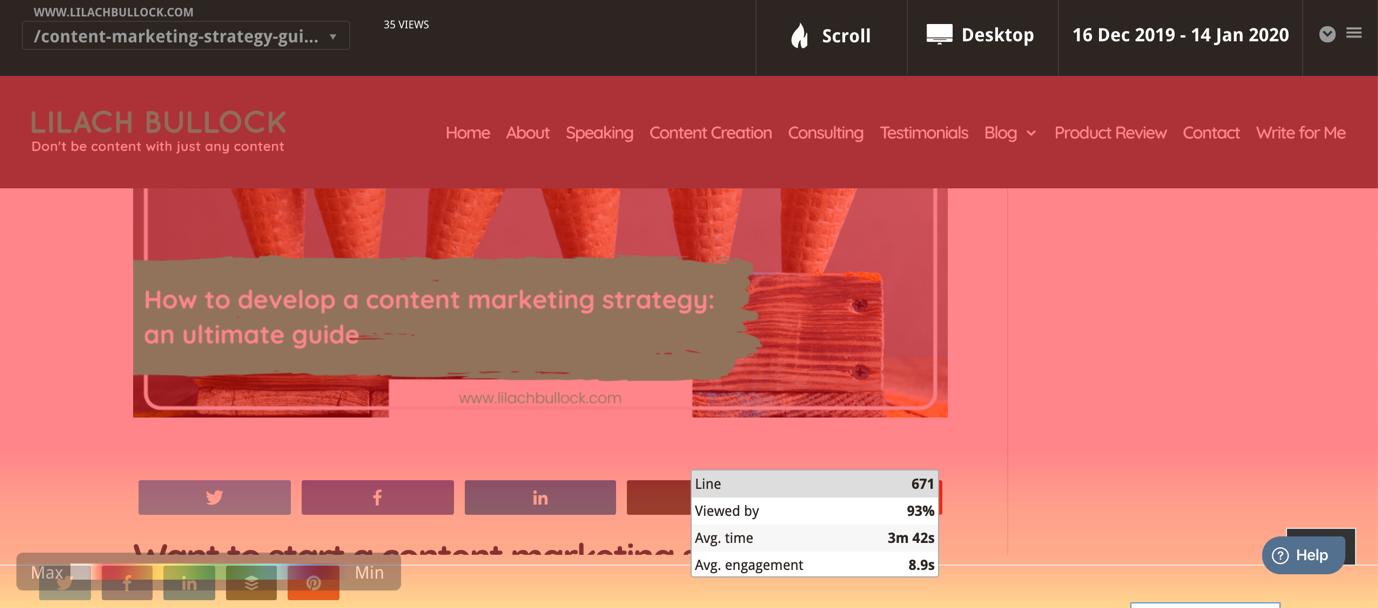
The “Fold” line is the point where users stop seeing the rest of your content once they visit a page; beyond that point, it’s only people who scroll down who will see the rest (and as you can see above, it tells you the exact percentage of people scrolling down).
This is particularly useful for homepages and landing pages; ideally, you want people to see certain things at first glance, without having to scroll further down, such as a call to action button on a landing page.
[click_to_tweet tweet=”The most effective way to improve the user experience and convert more visitors using @mouseflow #conversion #businesstips” quote=”The most effective way to improve the user experience and convert more visitors using @mouseflow #conversion #businesstips”]
Attention heatmap
What catches people’s attention on your website? This is where the Attention heatmap comes in to help:
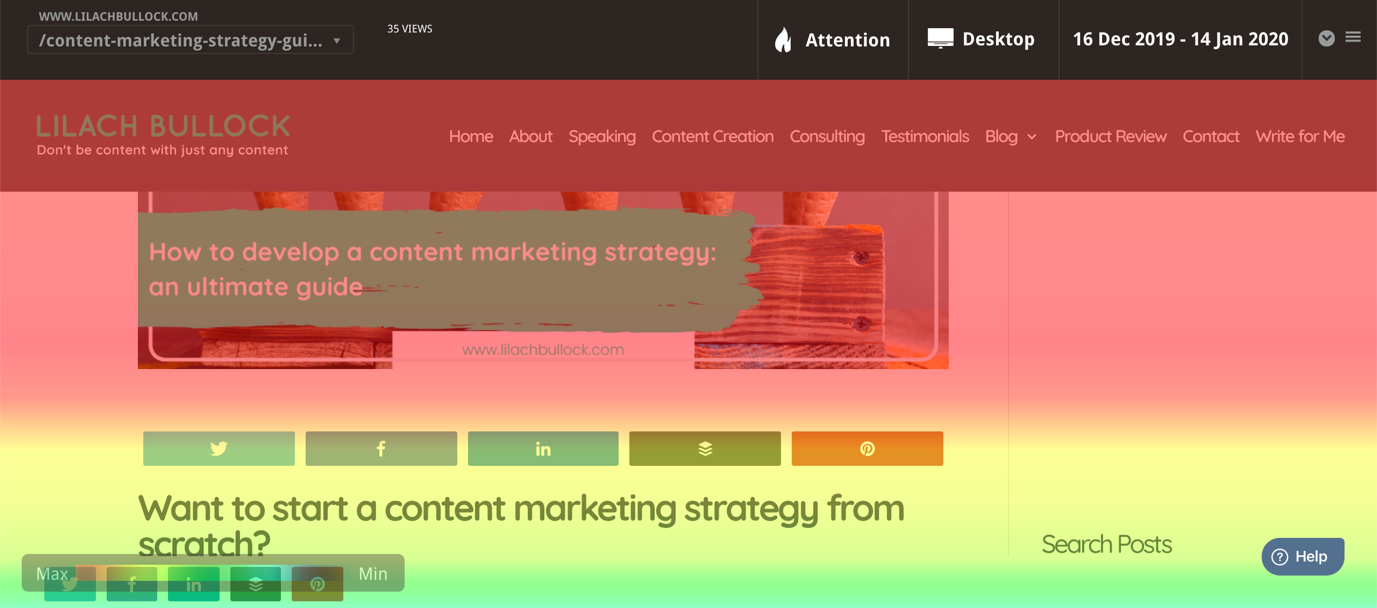
For example, here I can see that certain categories are more relevant to my visitors than others; based on that knowledge, I could move those categories higher up so that more people will see them, and hopefully, stay for longer on the website.
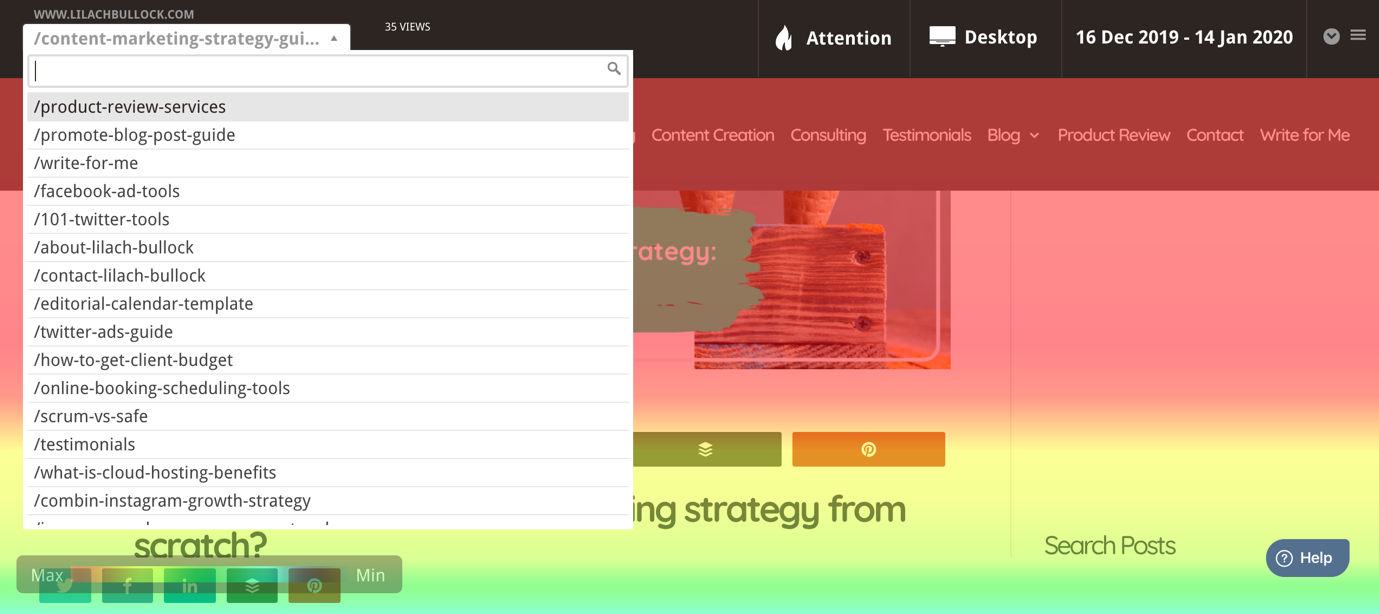
Once you’re in any heatmap, you can easily change the heatmap type as I showed you earlier, as well as change the device and the time period tracked.
Apart from that, you can also change which page you’re examining:
How are your sales funnels and opt-in forms performing?
Checking out how individual pages are performing is great – but what about your forms and your funnels?
How do people travel through your website?
Are they following the funnel as you expect them to?
Or are they dropping out at some point and if so, why does it happen and what can you do to change that?
To track your visitors’ journeys, all you have to do is set up Funnels in Mouseflow; this is super easy to do, as you can see below:
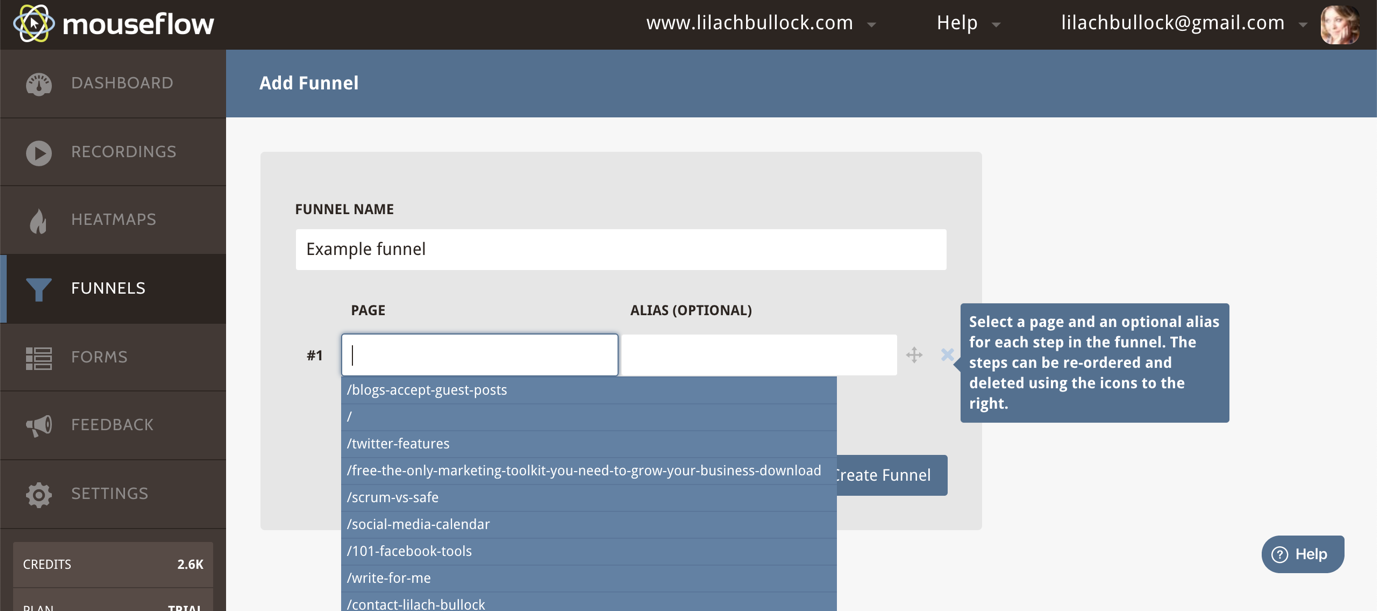
You just need to give your funnel a name and then add the pages that make up your funnel. For example, you might want to see how many people go from your homepage to your contact page and use the form. Whatever funnel you want to track, it’s all very easy to set up by simply adding the pages in order.
You’ll then be able to see where visitors are dropping and try to understand why that is:
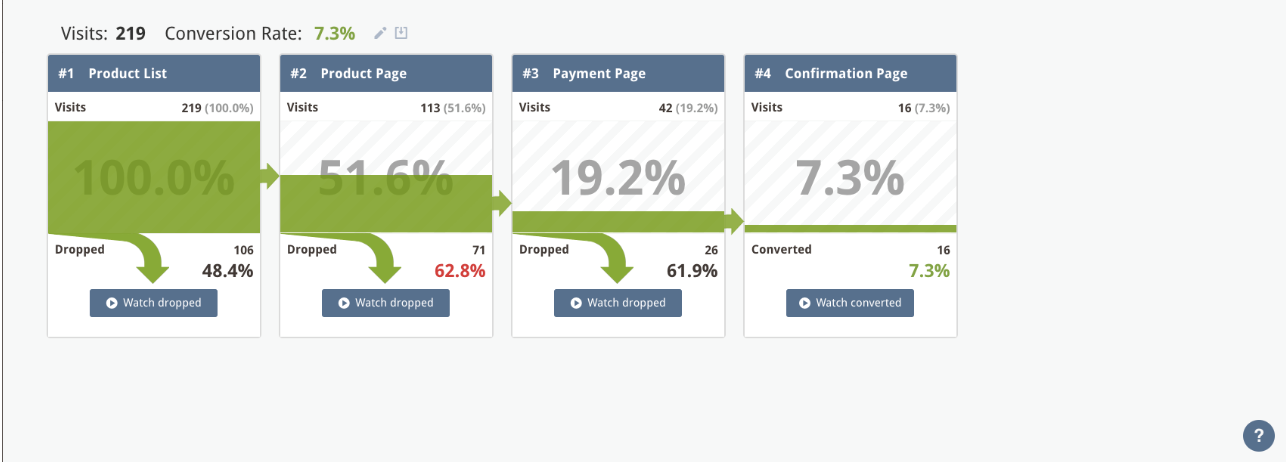
You’ll be able to see:
- How many visitors entered your funnel
- What the overall conversion rate is for your funnel
- See how many people dropped for each step
Once you’ve identified where your users get lost, you can check to see a recording list of all the users who dropped at that specific point (just click on Watch Dropped for that specific page).
Then, you’ll be able to see if any elements frustrated them (for example, if the page was loading too slowly or they went into a click-rage because an element wasn’t working) as well as exactly what their user experience was like if you watch the video recording.
Using this information, you can then optimize your pages and your funnel in order to make their experience go as smoothly as possible and therefore, drive more conversions on your website.
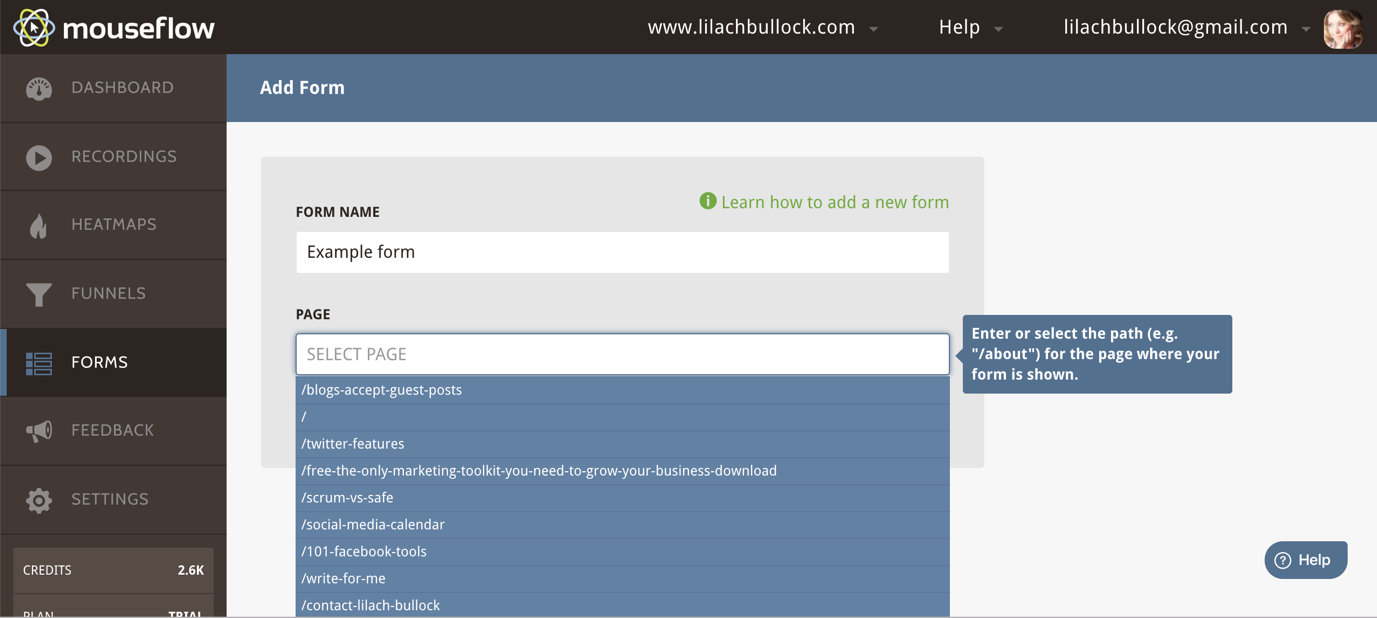
Another very cool thing you can do is see how your forms are performing and how people are interacting with them.
Likewise, they’re very easy to set up; just give your form a name, select the page where your form is located and then select the specific form you want to track (in case you have more than 1 form on that page):
Once you’ve set that up, Mouseflow will automatically start tracking your forms’ performance (including historical data):
![]()
At first glance, you can see, for each form:
- How many visits they had
- How many interactions with the form
- How many actually converted (i.e. completed the form)
And if you want to see exactly how people interacted with the form, then click on “view full report”:
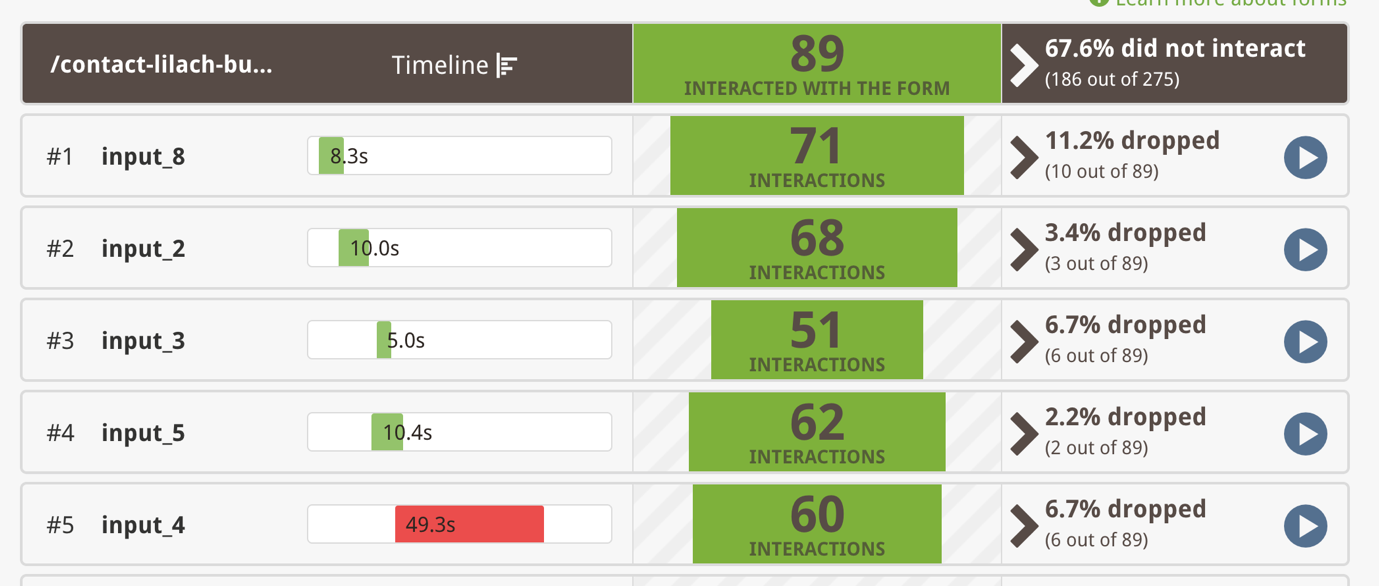
As you can see above, you can tell which questions are making people drop off and leave the form; this will tell you if you need to remove any questions or fields from your form in order to increase your conversions – even changing/removing one field can make a huge difference to your conversion rates.
[click_to_tweet tweet=”The most effective way to improve the user experience and convert more visitors using @mouseflow #conversion #businesstips” quote=”The most effective way to improve the user experience and convert more visitors using @mouseflow #conversion #businesstips”]
Conclusion
Optimizing your website can yield amazing results for your business – it can help keep people on your website for longer, make them visit more pages in one go and most importantly, it can help you boost your conversion rates dramatically.

Follow Lilach