

Follow Lilach
Dataslayer: How to create unlimited reports for your marketing campaigns
As a marketer, your work goes beyond planning and running marketing campaigns. While you think your YouTube video ad is wonderful, your boss may just be interested in its ROI.
This is where reporting comes in. Reporting makes it easy to present vital numbers to your campaign goals.
Unfortunately, very few marketers want to collate numbers, create tables, and design charts. If you prefer watching paint dry to crunching numbers, then you need a tool that can do the hard work for you.
Now, there are many reporting tools on the market today. Before you go for a tool, some factors to consider include:
- Number of integrations: what’s the point of a tool that doesn’t support the marketing platforms you use? It’s important to verify that a tool supports all the marketing platforms you run campaigns.
- Types of reports supported: there are different types of reports, and clients can have different preferences. It makes your work easier if you have many options.
- Your budget: your overall marketing budget will determine which tool and plan you can subscribe to.
- Customer support: except you’re a reporting guru, you may need help exploiting the essential features of a reporting tool. This is why you need to purchase a tool that offers responsive customer support.
Having said these, I want to review a data reporting tool that I’ve found interesting. In this Dataslayer review, I’ll dive into the tool to see how it can help you create better marketing reports.
How to create better marketing reports with Dataslayer
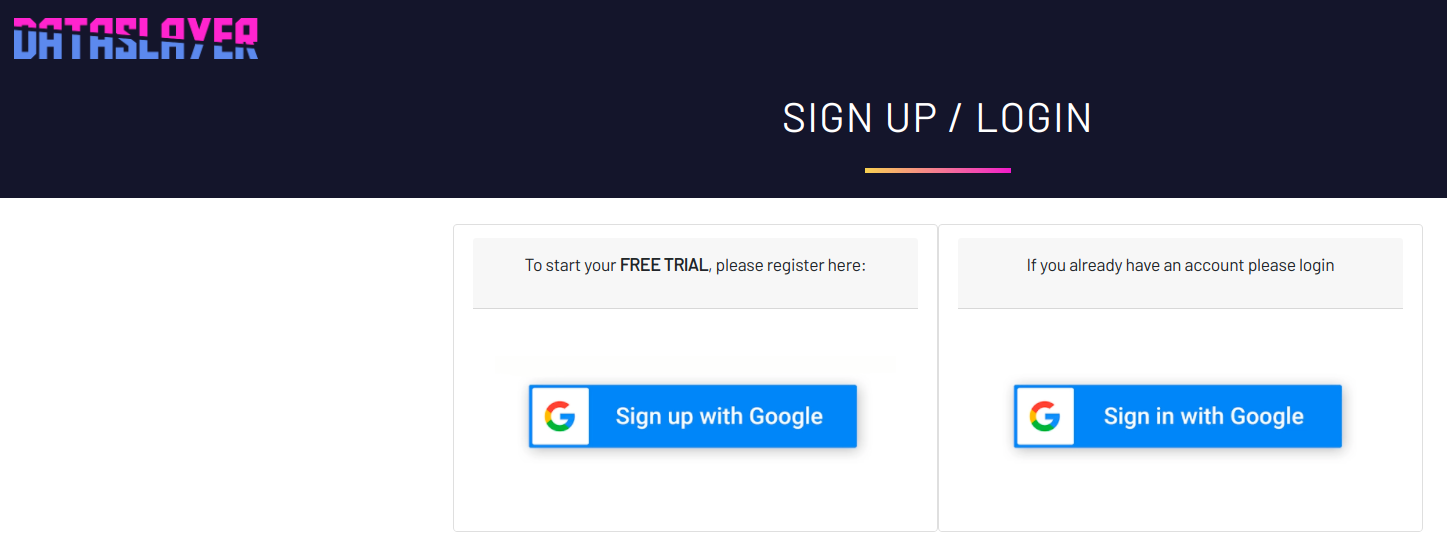
To begin, register for a 14-day free trial. During this period, you can create reports to see if the tool fits your needs.
To make the registration easier, Dataslayer allows you to register with your Google account. And since you’ll mostly use Google products like Sheets and Data Studio to create reports, this makes sense.
Once you connect to your Google account, you can complete your registration by filling in more details such as how you found Dataslayer, your company size, and your previous product.
After registration, Dataslayer will take you to your dashboard to see your subscription. Here, my trial includes Google Sheets and Google Data Studio. You also have the option to start trials for API Query Manager and BigQuery.
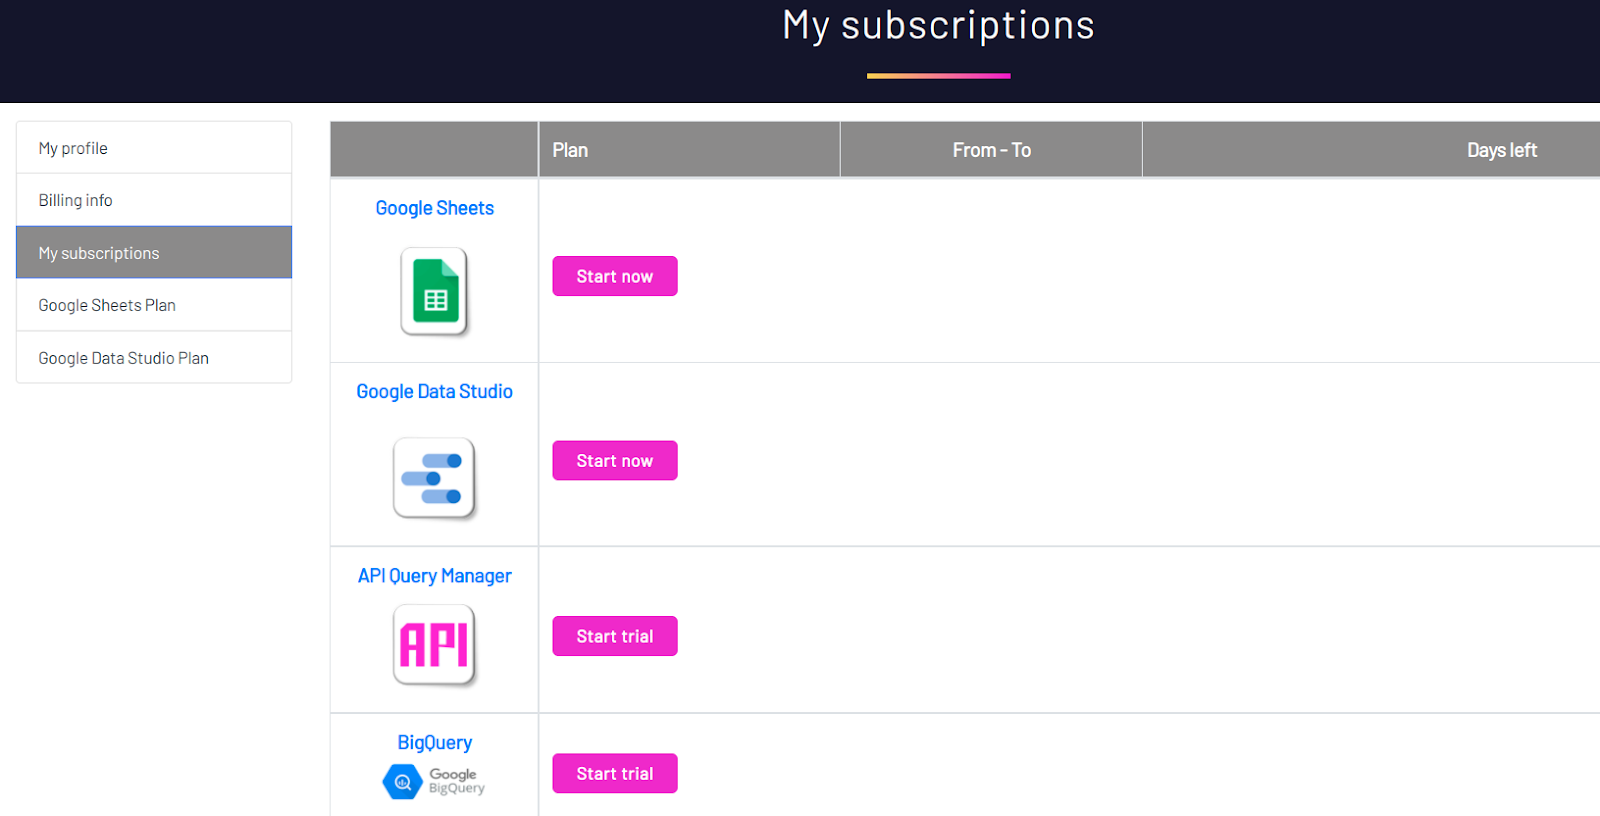
From here, you can begin to use the main tools in Dataslayer.
Dataslayer for Google Sheets
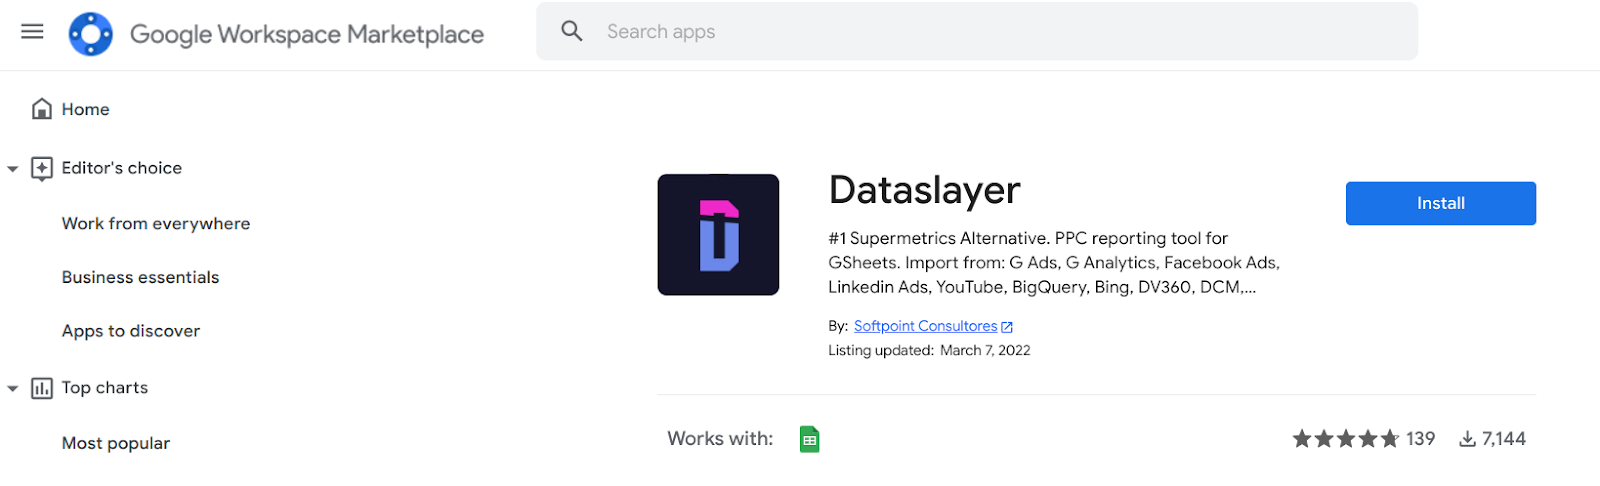
To begin using Dataslayer on Google Sheets, click on the “Start now” button. Once you do that, a new tab will open in the Google Workspace Marketplace where you have to install Dataslayer.
After installing the app, you have to grant permission to use the tool. To activate it, navigate to a Google Sheets document.
Then, click on “Extensions.” In the drop-down, you’ll see “Dataslayer” at the bottom of the options. There are even more actions when you hover on the “Dataslayer.”
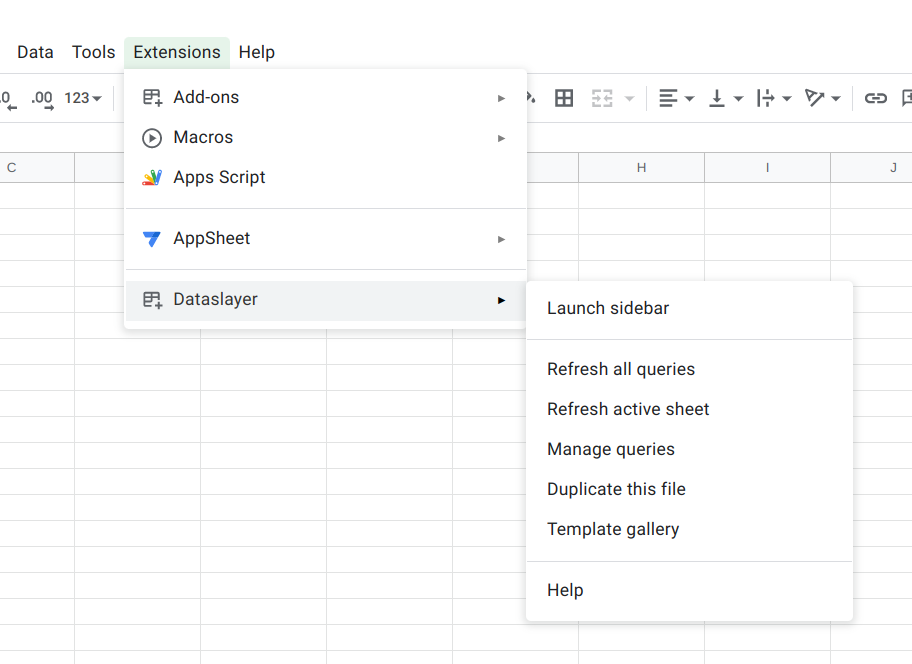
When I click on “Launch sidebar,” it brings up a sidebar at the right side of the page.
Since I haven’t connected a source, the sidebar is still empty. To select a source, click on the “Select datasource” drop-down.
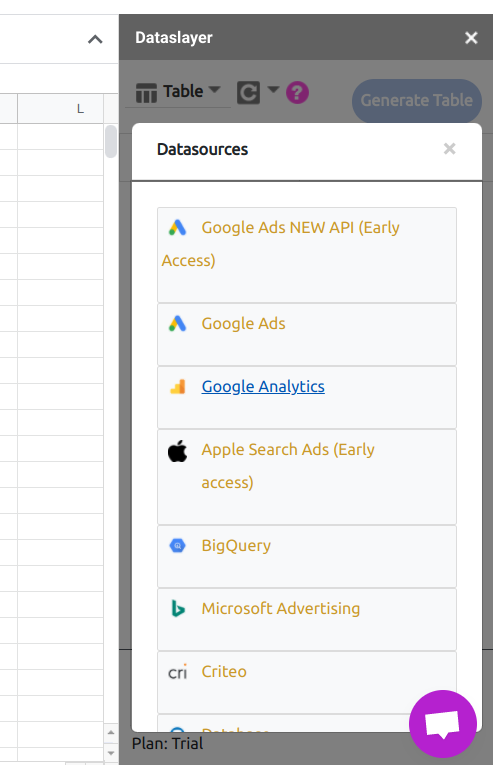
With over 40 data sources for Google Sheets, you’ll likely find your marketing platform here. The options here range from search to social media. I’ve selected Google Analytics among the options.
After that, I have to select the website for which I want to create a report. Also, if you want to analyze all the websites in your Google Analytics account, you can select all.
The next step is to select the metric you want to analyze. This will be a metric that’s vital to your campaign goals.
There are tons of metrics here, and you can select as many as you want. Apart from user metrics, you have metrics for content, events, paid campaigns, ad sense, and more.
Beyond metrics, you can also select dimensions. These include time, traffic sources, location, ecommerce, device, and more. With this, you can further dive deeper into how the traffic of various dimensions performs on your website.
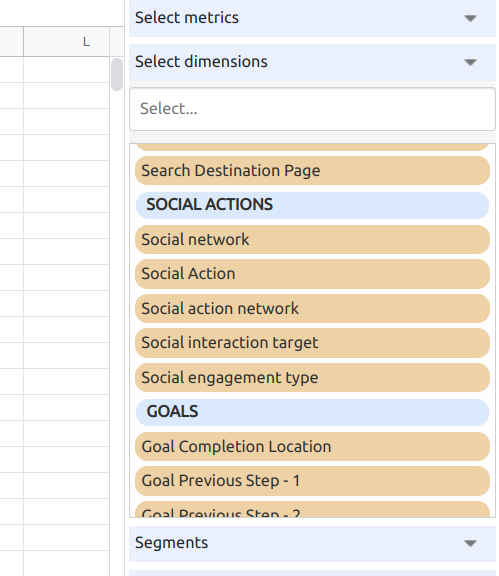
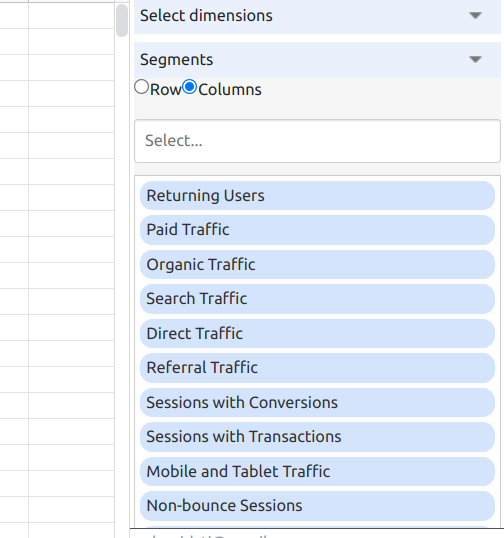
Another option is to segment your traffic based on different criteria. So, you can see the difference in bounce rates between paid traffic and organic traffic.
Put simply, there are endless combinations of data here. Therefore, it’s easy to have numbers that reveal the results of your marketing campaigns on your website.
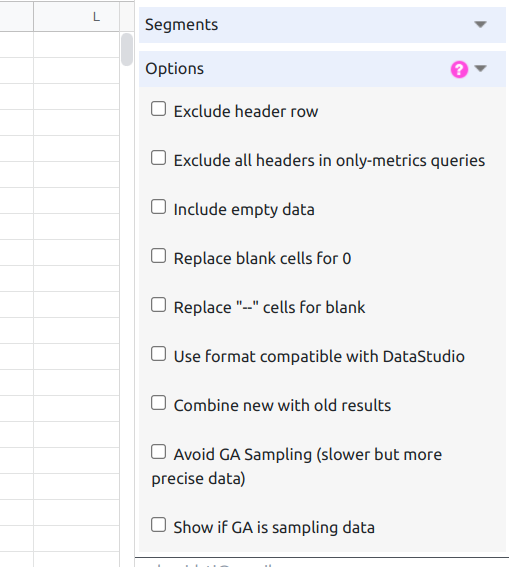
Below these, you also have options for your reports. For instance, you can use a format compatible with data studio or avoid GA sampling.
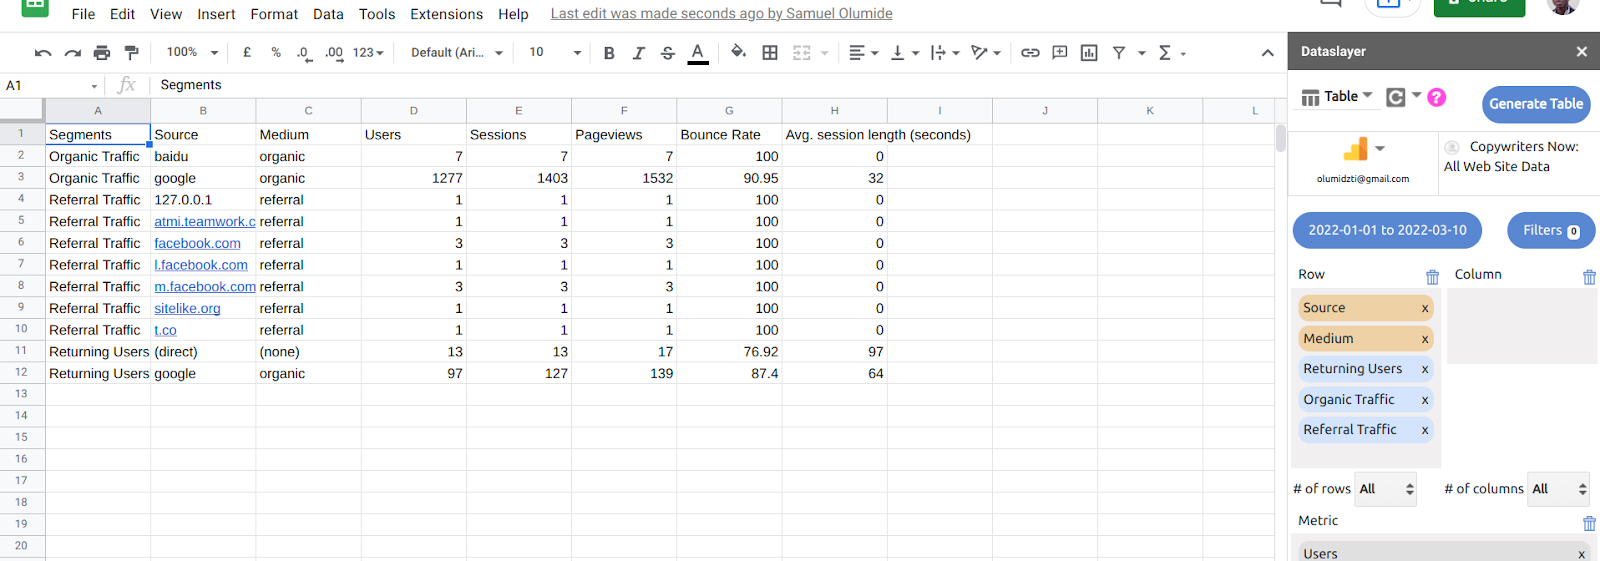
Once you’re done with these settings, click on the “Generate Table” button at the top.
At the top of the sidebar, there are more settings you can explore. For example, you can refresh queries to update your data.
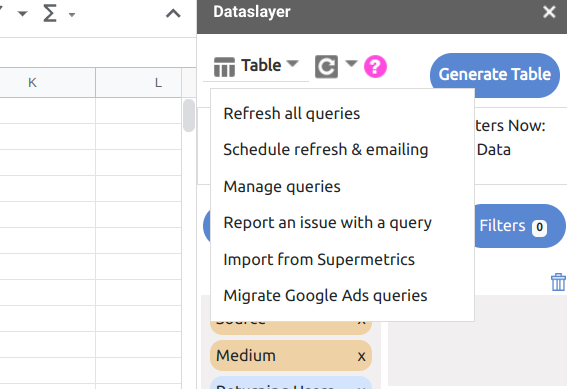
Furthermore, you can schedule refresh and emailing. When you click on “Schedule refresh and emailing,” you’ll see a popup to set up periods to refresh your data.
Another interesting task possible is “Import from Supermetrics.” If you used Supermetrics before migrating to Dataslayer, this option makes it easy to import your reports.
Once you click on “Import from Supermetrics,” Dataslayer will search through Google Sheets to find reports you created with Supermetrics. Then you can import them into your current sheets.
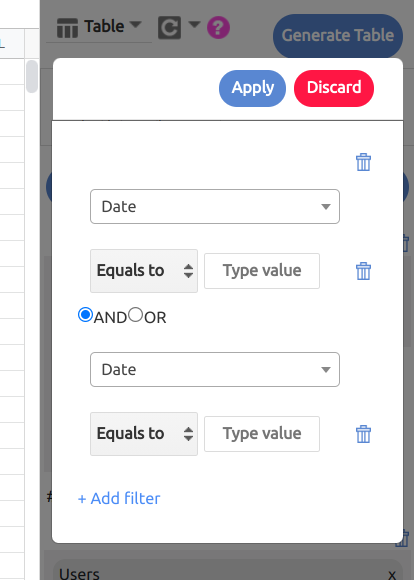
Apart from these, you can also add filters to your reports. To create a filter, click on “Filter” and specify its rules.
If you run a marketing agency, whether it is a SaaS marketing agency or a general one, you may need to create similar reports for many clients. It’s a waste of time to create a report for each client. Luckily, the duplication feature helps to avoid this.
To duplicate a report, click on “Extensions” at the top bar of your page and then hover on “Dataslayer.” Click on “Duplicate this file.”
In some cases, you may have no idea how to create a report for your campaign. In such cases, you’ll find the template gallery very useful.
To access the gallery, click on “Extensions,” “Dataslayer,” and “Template gallery.”
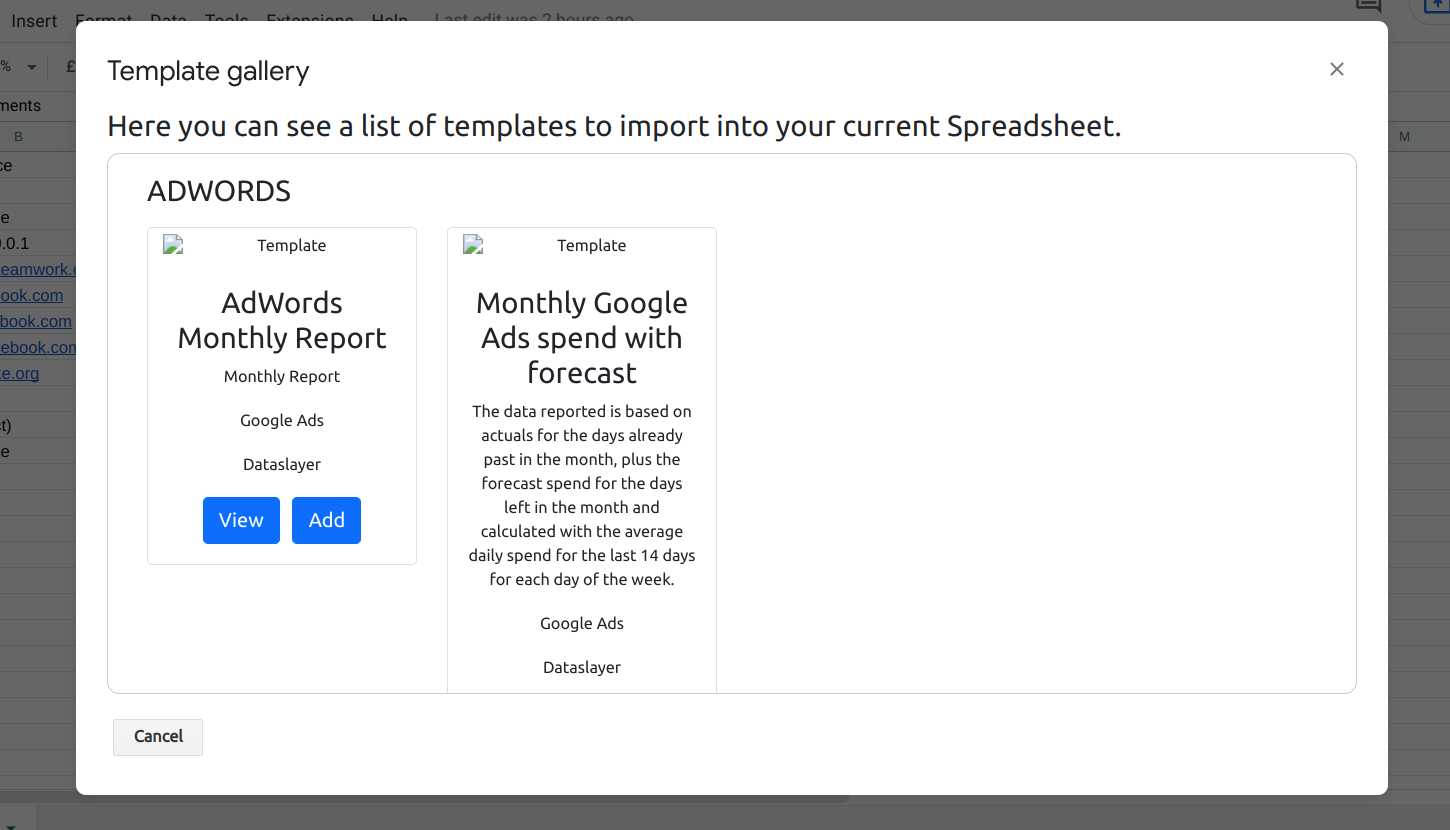
The templates are divided into AdWords, analytics, and Facebook insights. Before you use a template, Dataslayer allows you to view it to see what your final report will look like.
With Dataslayer, you can create reports on Google Sheets for most of your marketing platforms.
Dataslayer for Google Data Studio
Google Data Studio helps create beautiful reports for its platforms such as Google Sheets, Search Console, Google Ads, Google Analytics, and other Google services. One shortcut marketers use is first to import their data into Google Sheets and then transfer to Google Data Studio.
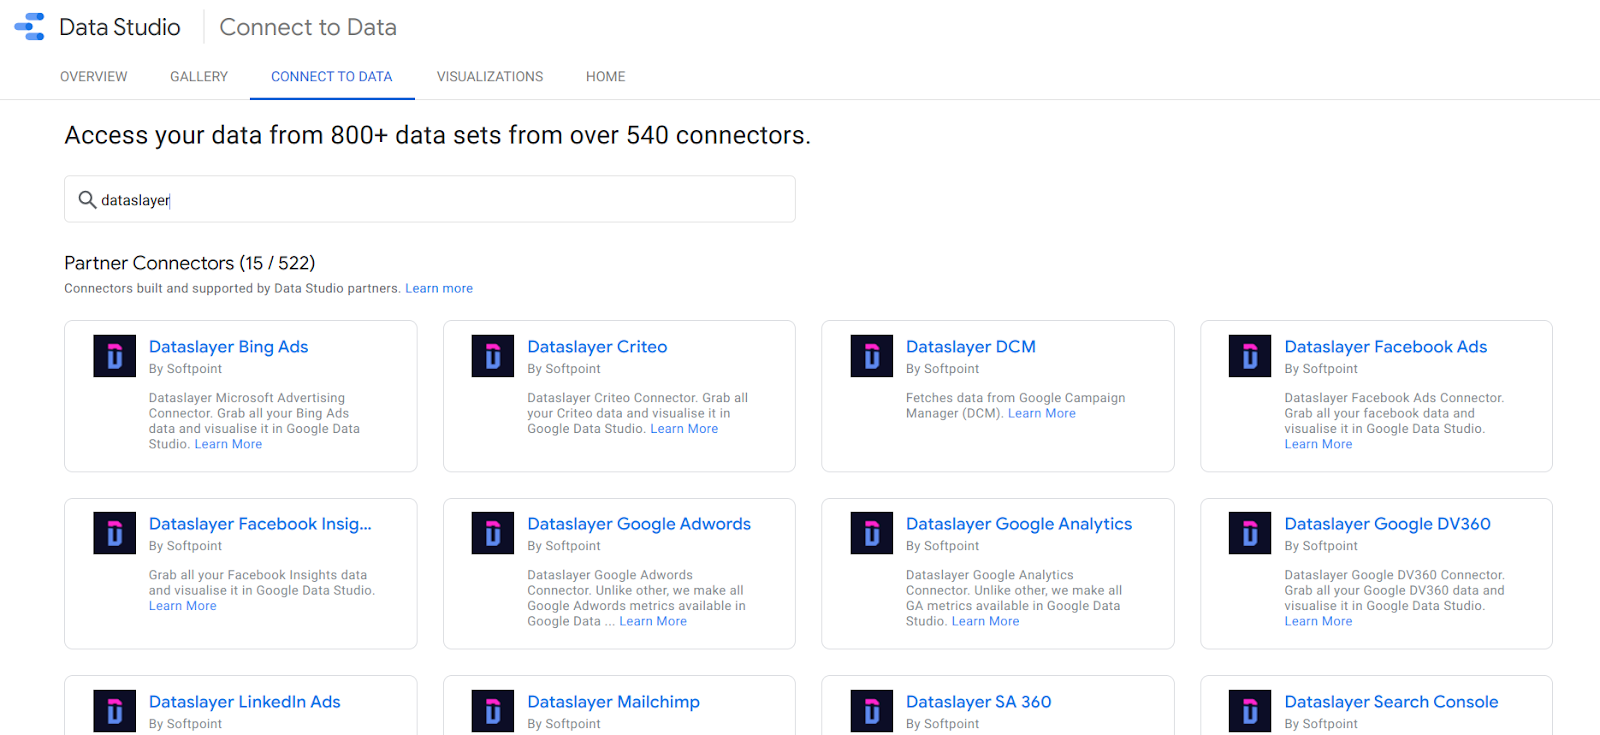
Luckily, with Dataslayer for Google Data Studio, you can connect your marketing channels directly to the platform. In fact, Dataslayer integrates with over 30 marketing channels.
To begin, navigate to your subscriptions on Dataslayer. Click on “Start now” beside Google Data Studio. Doing this will take you to the Data Studio page where you can select the channel you want to connect to.
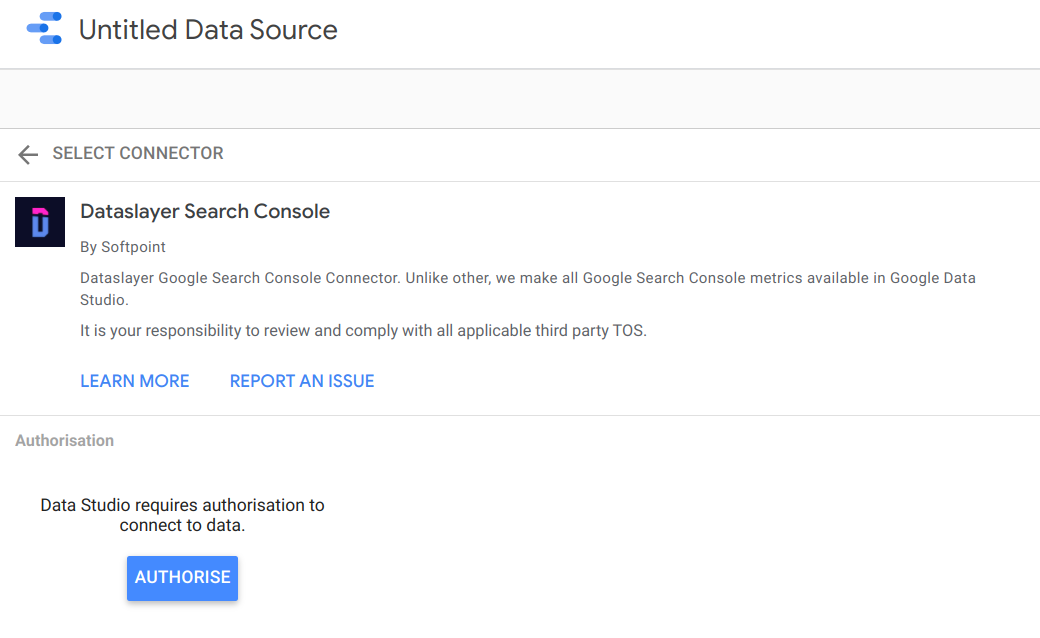
Here, I’ve selected Dataslayer Search Console among the options. After that, you have to authorize Dataslayer to access the data.
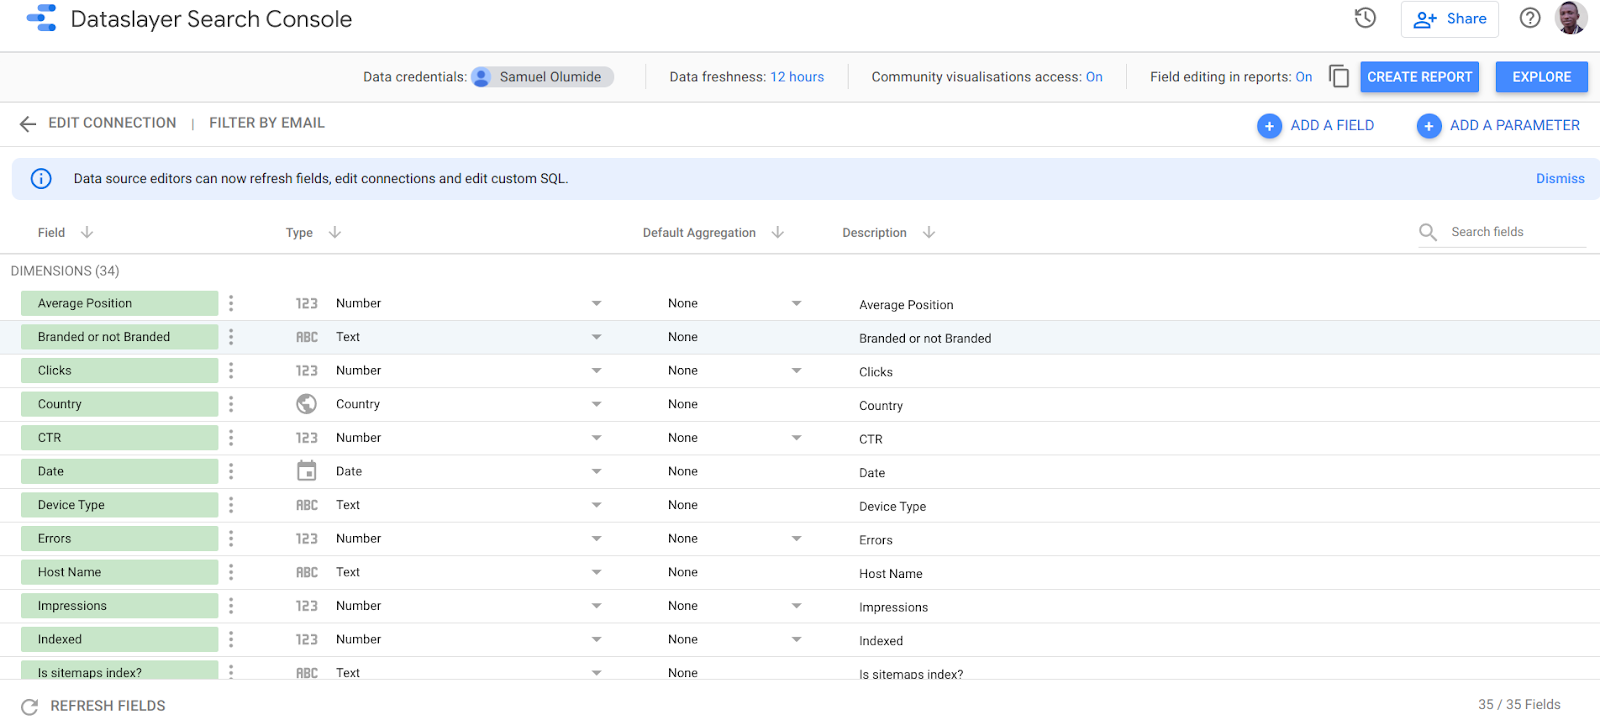
Once you’re done with authorization, you have to select the website you want to create a report for. This will open up different dimensions available on Search Console. You also have an option to add a field or parameter.
At the top right corner, you’ll see a “Create Report” button. Click on it to start designing your report. After doing this, a new tab will open. Click on “Edit” at the top right corner to design your report.
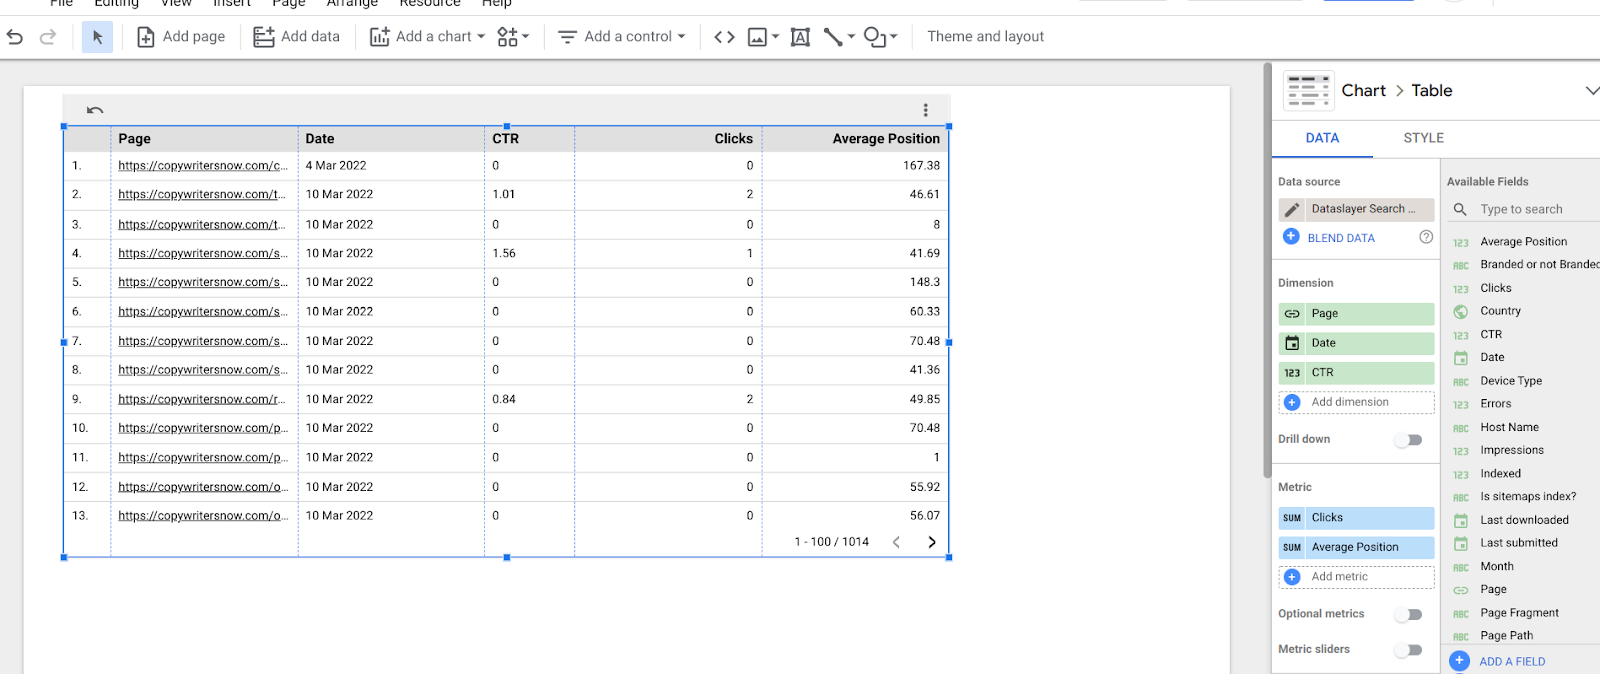
Here, you’ll find many editing options to customize it to your needs. For instance, you can add a page, data, a chart, or a control. Beyond that, there’s a theme and layout section for your reports. When you click on “Theme and layout,” you’ll find different layouts and colour themes you can use.
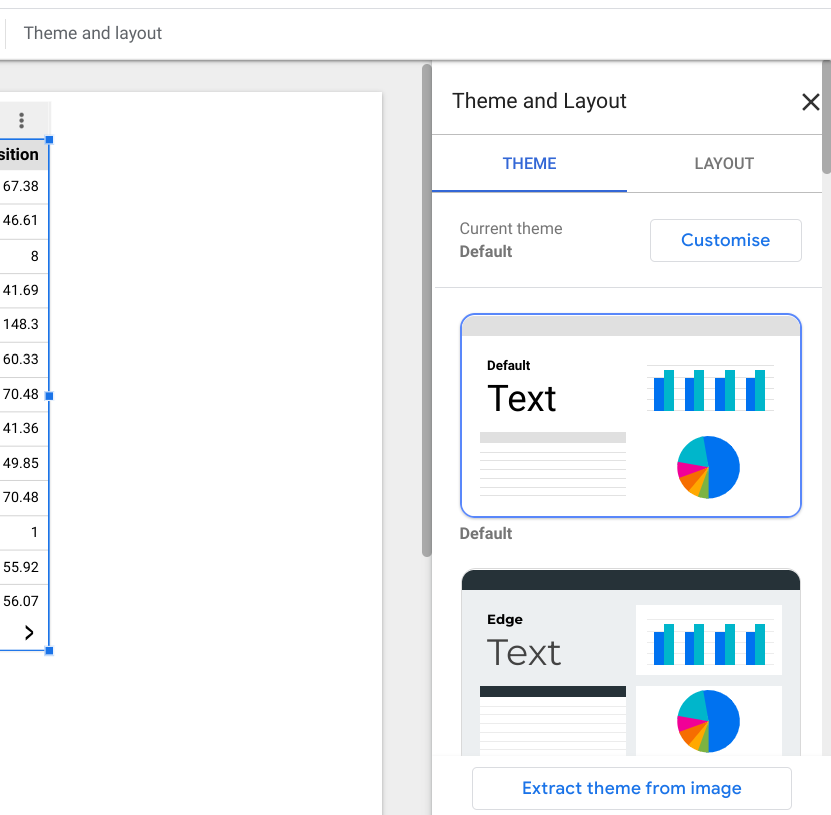
You also have the option to extract a theme from an image on your computer or from a URL. If you click on “Extract theme from image,” you’ll see the two options.
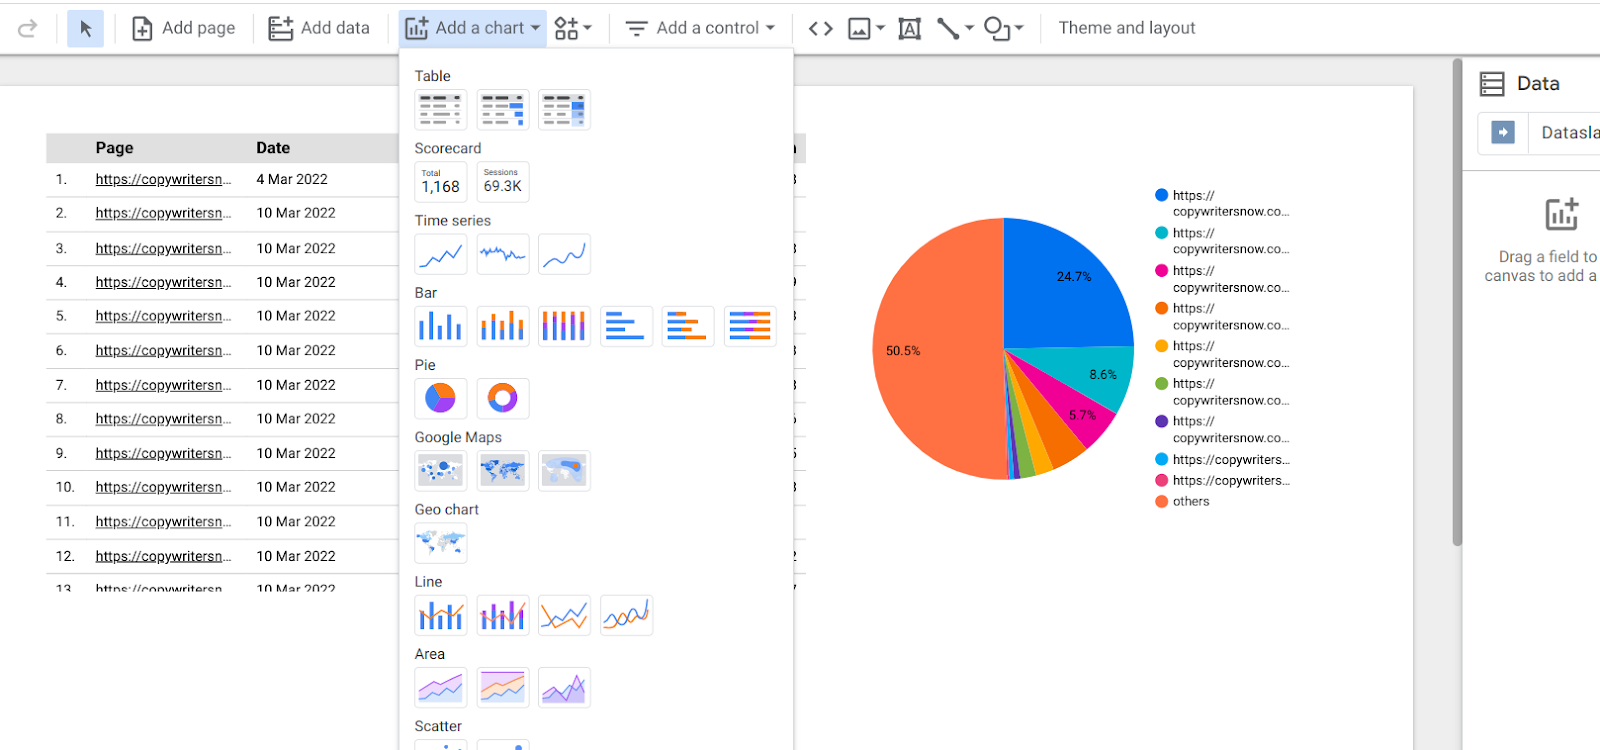
The “Add a chart” option allows you to add different types of charts according to your preferences.
When you’re done with the design, you can now download your report. To do this, click on “Share” at the top right corner of the page and select “Download report” among the options. Before you download (in PDF format), you can protect the report with a password or link back to it.
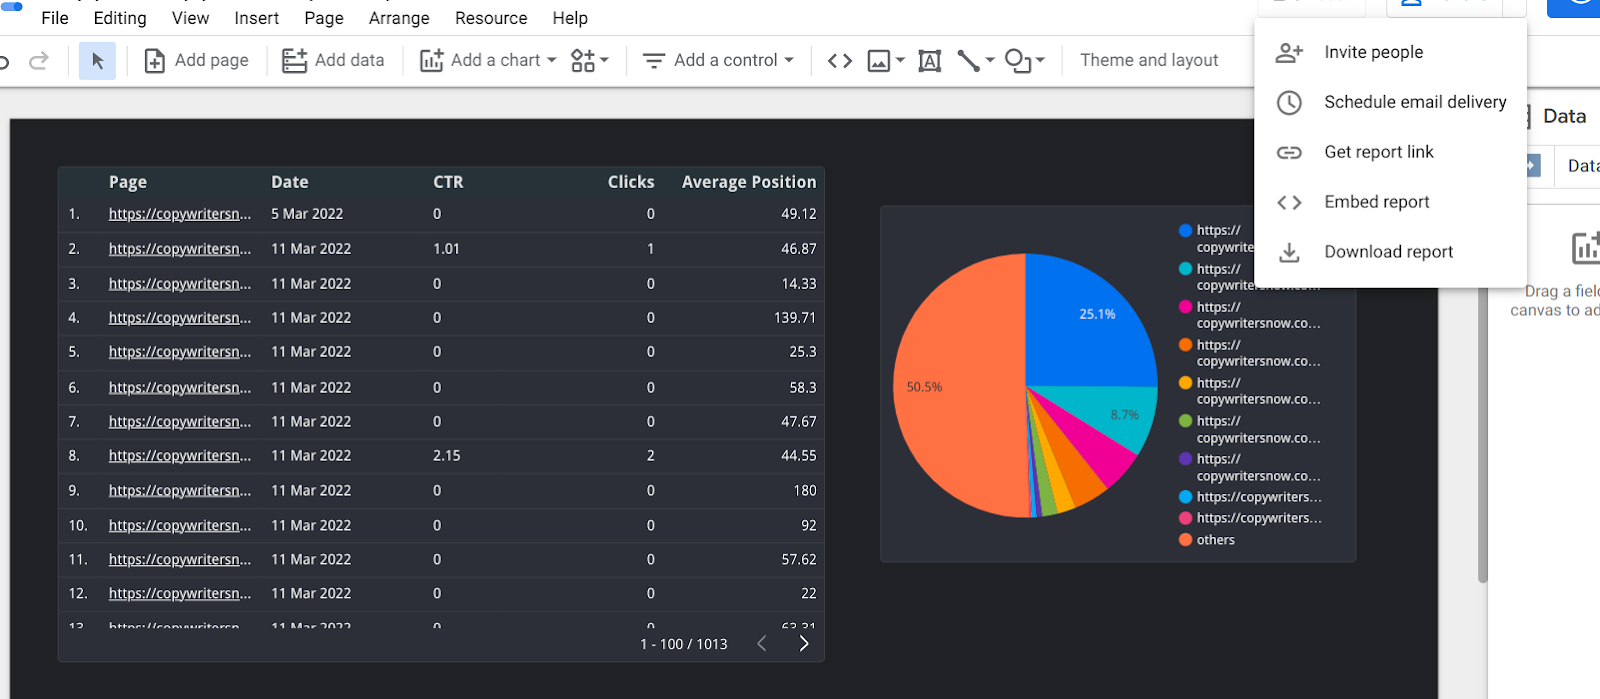
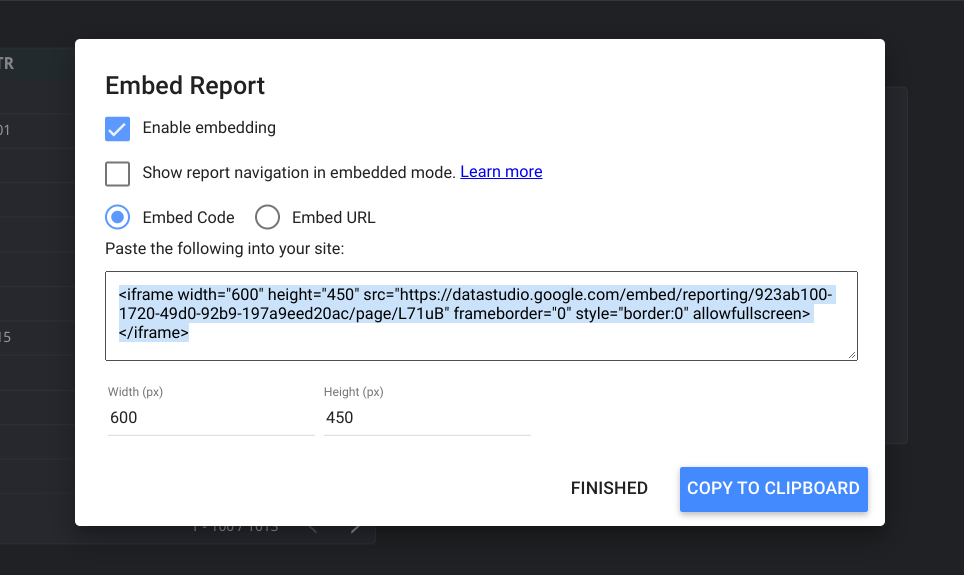
Beyond that, you can embed the report. There are options to embed code or URL. Besides, you can adjust the size and show report navigation.
Like other Google products, you can invite people to access this document. From clients to coworkers to designers, many people may need to contribute to your report.
If you want to deliver this report to your boss or client regularly, you can schedule an email delivery with details of your recipients and frequency of delivery.
With the options available here, you can create beautiful reports for most of your marketing campaigns.
Customer support
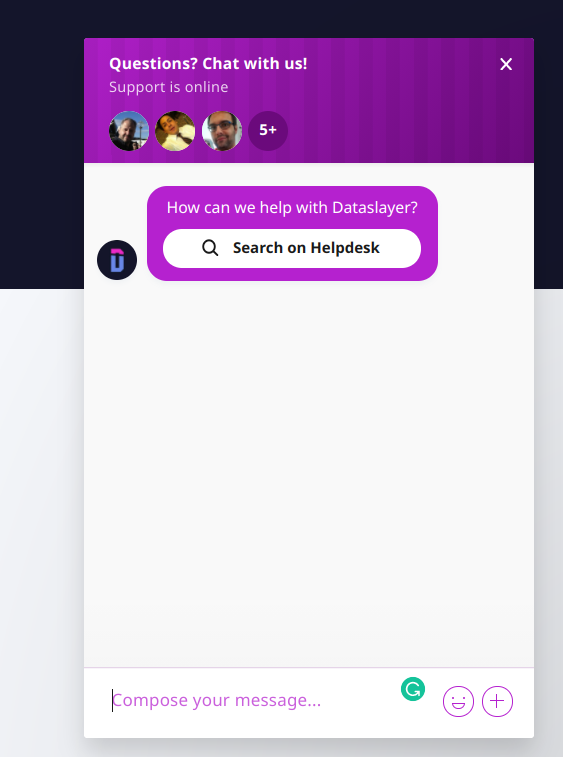
Due to the scale of this tool, Dataslayer offers customer support through these 4 channels:
- Live chat: this is the easiest to use as you can even see a live chat button right inside Google Sheets. You don’t need to visit the website to access this channel.
- Blog posts: there are blog posts that address different activities on Dataslayer.
- Support forum: here, you can make integration requests, and take other actions.
- Contact form: fill this form with the details of your issues.
Through these customer support channels, it’s easy to get solutions to issues you encounter while using Dataslayer.
Pricing
Dataslayer has subscription plans that ensure you pay according to your usage. Unlike Supermetrics which charges according to the number of users in an account, Dataslayer charges based on the number of API calls you make daily.
This means a spreadsheet that contains Google Search Console and Twitter data, and refreshes daily will make 2 API calls. Every plan offers an unlimited number of reports and users.
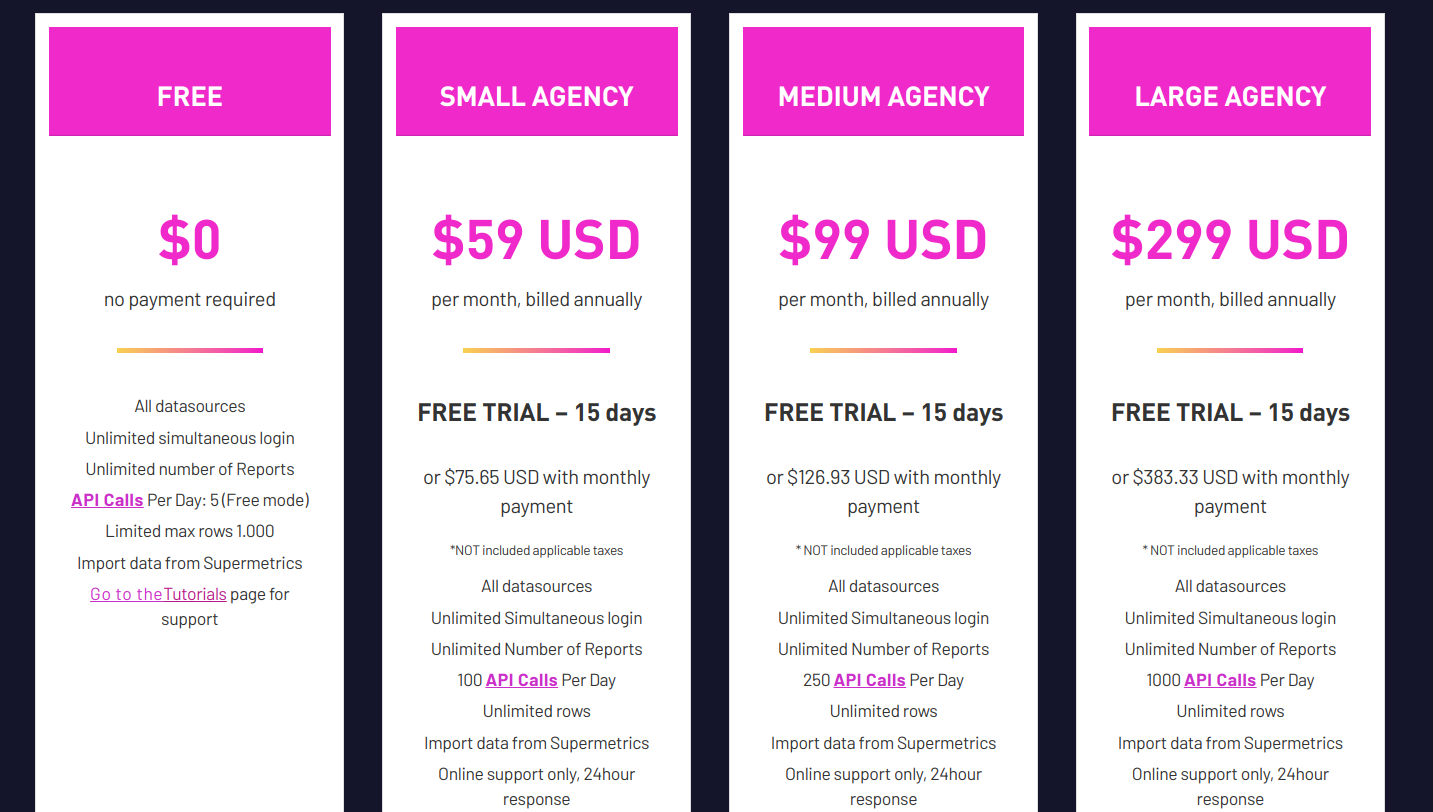
The plans for Google Sheets include:
- Free: you have access to 5 API calls per day.
- Small agency: this plan comes with 100 API calls per day and costs $59 monthly (on an annual plan).
- Medium agency: you have access to 250 API calls per day, and it costs $99 monthly.
- Large agency: this plan comes with 1,000 API calls per day and costs $299 monthly.
The plans for Google Data Studio include:
- Free: you have access to 15 API calls daily.
- Small agency: this plan provides 500 API calls daily and costs $59 monthly.
- Medium agency: you have access to 1,250 API calls daily, and it costs $99 monthly.
- Large agency: this plan comes with 4,000 API calls and costs $299 per month.

You can go to the Dataslayer pricing page to obtain more details about the plans.
Conclusion
To your client, providing no marketing report means you’re doing a poor job marketing their business. Therefore, investing in a tool that automates your reports makes sense.
With Dataslayer, it’s easy to create your reports and even schedule their delivery to your clients. Thereby, you can show the results of your marketing campaigns and measure ROI effectively.
And to make things risk-free, you can register for the free plan or go through free trials for the paid plans. So, you can derive the benefits before you even pay a dime.
How can Dataslayer help your business? Let me know in the comments!

Follow Lilach